Estimated Value: $667,187 - $804,000
--
Bed
--
Bath
950
Sq Ft
$760/Sq Ft
Est. Value
About This Home
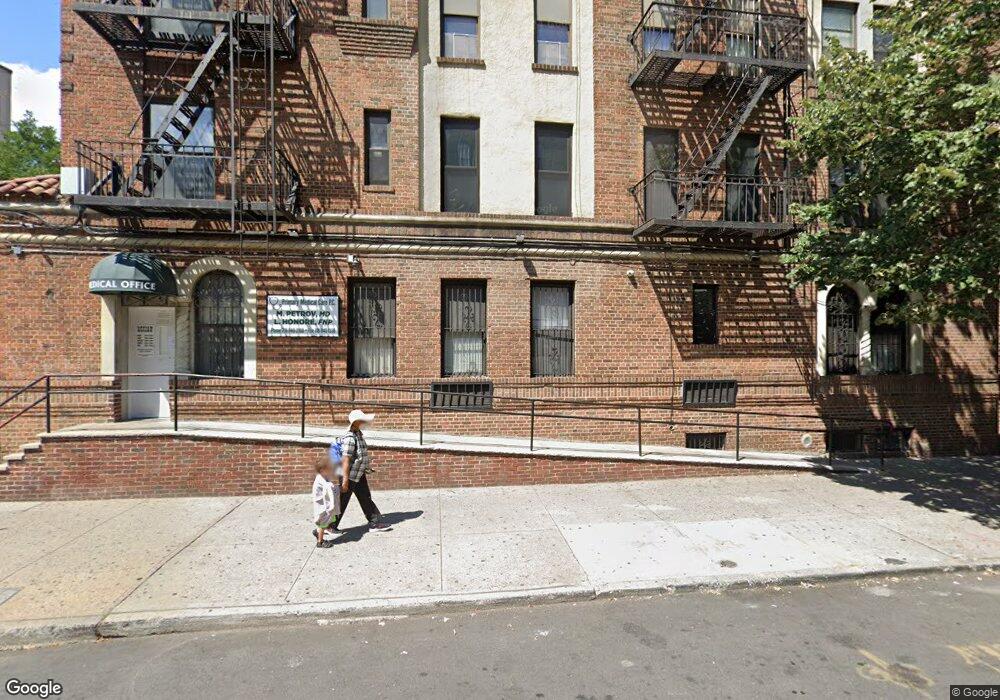
This home is located at 353 Ocean Ave Unit 5J, Brooklyn, NY 11226 and is currently estimated at $721,547, approximately $759 per square foot. 353 Ocean Ave Unit 5J is a home located in Kings County with nearby schools including P.S. 375 Jackie Robinson School, Ebbets Field Middle School, and Flatbush Ascend Charter School.
Ownership History
Date
Name
Owned For
Owner Type
Purchase Details
Closed on
Apr 14, 2005
Sold by
Lackner Benjamin S and Velasquez Sandra L
Bought by
Lackner Benjamin S
Current Estimated Value
Purchase Details
Closed on
Apr 26, 2002
Sold by
Faber Bernhard and Faber Sonya
Bought by
Lackerner Benjamin S and Velasquez Sandra L
Home Financials for this Owner
Home Financials are based on the most recent Mortgage that was taken out on this home.
Original Mortgage
$135,000
Outstanding Balance
$56,722
Interest Rate
7%
Mortgage Type
Purchase Money Mortgage
Estimated Equity
$664,825
Purchase Details
Closed on
May 21, 2001
Sold by
Ocean Woodruff Developme
Bought by
Faber Bernhard and Faber Sonya
Home Financials for this Owner
Home Financials are based on the most recent Mortgage that was taken out on this home.
Original Mortgage
$130,625
Interest Rate
7.15%
Mortgage Type
Purchase Money Mortgage
Create a Home Valuation Report for This Property
The Home Valuation Report is an in-depth analysis detailing your home's value as well as a comparison with similar homes in the area
Home Values in the Area
Average Home Value in this Area
Purchase History
| Date | Buyer | Sale Price | Title Company |
|---|---|---|---|
| Lackner Benjamin S | -- | -- | |
| Lackner Benjamin S | -- | -- | |
| Lackerner Benjamin S | -- | -- | |
| Lackerner Benjamin S | -- | -- | |
| Faber Bernhard | -- | -- | |
| Faber Bernhard | -- | -- |
Source: Public Records
Mortgage History
| Date | Status | Borrower | Loan Amount |
|---|---|---|---|
| Open | Lackerner Benjamin S | $135,000 | |
| Closed | Lackerner Benjamin S | $135,000 | |
| Previous Owner | Faber Bernhard | $130,625 |
Source: Public Records
Tax History Compared to Growth
Tax History
| Year | Tax Paid | Tax Assessment Tax Assessment Total Assessment is a certain percentage of the fair market value that is determined by local assessors to be the total taxable value of land and additions on the property. | Land | Improvement |
|---|---|---|---|---|
| 2025 | $4,029 | $38,967 | $2,523 | $36,444 |
| 2024 | $4,029 | $35,378 | $2,523 | $32,855 |
| 2023 | $3,826 | $31,626 | $2,523 | $29,103 |
| 2022 | $3,700 | $31,312 | $2,523 | $28,789 |
| 2021 | $3,506 | $29,055 | $2,523 | $26,532 |
| 2020 | $2,659 | $33,777 | $2,523 | $31,254 |
| 2019 | $3,343 | $30,188 | $2,523 | $27,665 |
| 2018 | $3,166 | $26,865 | $2,522 | $24,343 |
| 2017 | $3,061 | $25,970 | $2,522 | $23,448 |
| 2016 | $2,994 | $25,152 | $2,523 | $22,629 |
| 2015 | $1,711 | $24,400 | $2,523 | $21,877 |
| 2014 | $1,711 | $22,116 | $2,523 | $19,593 |
Source: Public Records
About This Building
Map
Nearby Homes
- 353 Ocean Ave Unit 4G
- 416 Ocean Ave Unit 50
- 416 Ocean Ave Unit 87
- 416 Ocean Ave Unit 15
- 17 Clarkson Ave
- 5 Parkside Ct
- 40 Clarkson Ave Unit 2L
- 40 Clarkson Ave Unit 1J
- 77 Clarkson Ave Unit 7A
- 77 Clarkson Ave Unit 4C
- 77 Clarkson Ave Unit 1 H
- 500 Ocean Ave Unit 5C
- 500 Ocean Ave Unit 3A
- 12 Martense Ct
- 10 Martense Ct
- 80 Winthrop St Unit R2
- 80 Winthrop St Unit L1
- 80 Winthrop St Unit Y6
- 80 Winthrop St Unit P1
- 8 Martense Ct
- 353 Ocean Ave Unit 2C
- 353 Ocean Ave Unit 6J
- 353 Ocean Ave Unit 4J
- 353 Ocean Ave Unit 3J
- 353 Ocean Ave Unit 2J
- 353 Ocean Ave Unit 1J
- 353 Ocean Ave Unit 6I
- 353 Ocean Ave Unit 5I
- 353 Ocean Ave Unit 4I
- 353 Ocean Ave Unit 3I
- 353 Ocean Ave Unit 2I
- 353 Ocean Ave Unit 1I
- 353 Ocean Ave Unit 6H
- 353 Ocean Ave Unit 5H
- 353 Ocean Ave Unit 4H
- 353 Ocean Ave Unit 3H
- 353 Ocean Ave Unit 2H
- 353 Ocean Ave Unit 6G
- 353 Ocean Ave Unit 5G
- 353 Ocean Ave Unit 3G