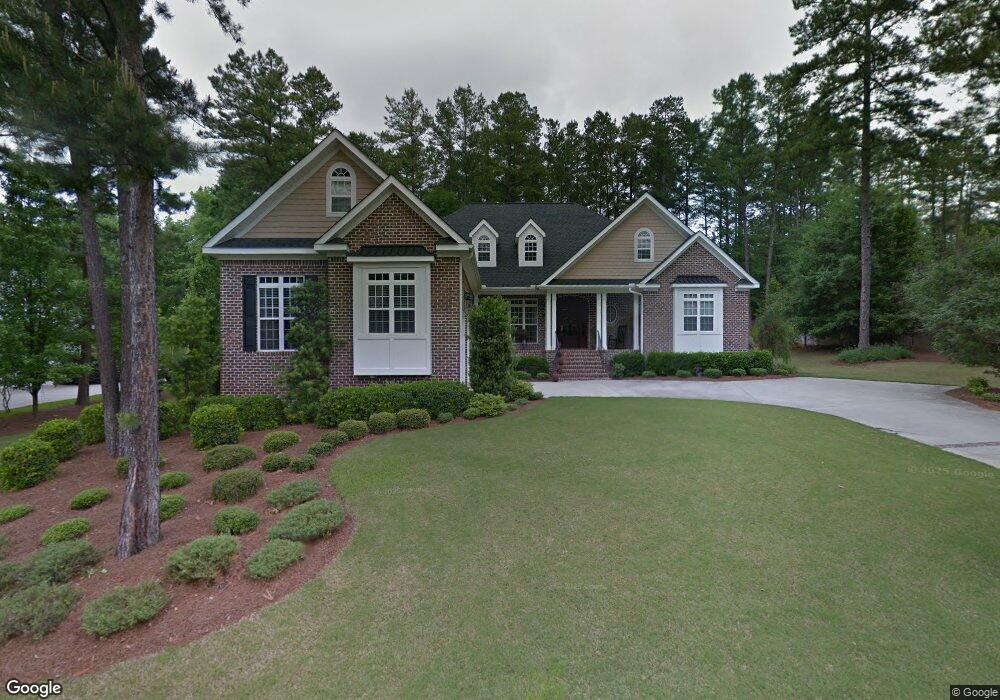
353 River Wind Dr North Augusta, SC 29841
Estimated Value: $589,000 - $697,000
3
Beds
3
Baths
2,939
Sq Ft
$215/Sq Ft
Est. Value
About This Home
This home is located at 353 River Wind Dr, North Augusta, SC 29841 and is currently estimated at $632,910, approximately $215 per square foot. 353 River Wind Dr is a home located in Aiken County with nearby schools including North Augusta Elementary School, Paul Knox Middle School, and North Augusta High School.
Ownership History
Date
Name
Owned For
Owner Type
Purchase Details
Closed on
May 31, 2011
Sold by
Brooks Lorick V and Brooks Elizabeth H
Bought by
Dickson James D and Dickson Carolyn W
Current Estimated Value
Purchase Details
Closed on
Feb 16, 2006
Sold by
Gray Monte C
Bought by
Brooks Lorick V and Brooks Elizabeth H
Home Financials for this Owner
Home Financials are based on the most recent Mortgage that was taken out on this home.
Original Mortgage
$76,321
Interest Rate
6.08%
Mortgage Type
Purchase Money Mortgage
Purchase Details
Closed on
Sep 8, 2005
Sold by
Brooks Lorick and Brooks Elizabeth H
Bought by
Gray Monte C
Purchase Details
Closed on
Mar 24, 2005
Sold by
Sigla & Associates
Bought by
Brooks Lorick and Brooks Elizabeth H
Home Financials for this Owner
Home Financials are based on the most recent Mortgage that was taken out on this home.
Original Mortgage
$48,000
Interest Rate
5.62%
Mortgage Type
Purchase Money Mortgage
Create a Home Valuation Report for This Property
The Home Valuation Report is an in-depth analysis detailing your home's value as well as a comparison with similar homes in the area
Purchase History
| Date | Buyer | Sale Price | Title Company |
|---|---|---|---|
| Dickson James D | $415,000 | -- | |
| Brooks Lorick V | $317,000 | None Available | |
| Gray Monte C | $48,692 | -- | |
| Brooks Lorick | $48,290 | -- |
Source: Public Records
Mortgage History
| Date | Status | Borrower | Loan Amount |
|---|---|---|---|
| Previous Owner | Brooks Lorick V | $76,321 | |
| Previous Owner | Brooks Lorick | $48,000 |
Source: Public Records
Tax History
| Year | Tax Paid | Tax Assessment Tax Assessment Total Assessment is a certain percentage of the fair market value that is determined by local assessors to be the total taxable value of land and additions on the property. | Land | Improvement |
|---|---|---|---|---|
| 2025 | $1,887 | $18,840 | -- | -- |
| 2023 | $1,890 | $18,830 | $3,600 | $380,900 |
| 2022 | $1,834 | $18,780 | $0 | $0 |
| 2021 | $1,838 | $18,780 | $0 | $0 |
| 2020 | $1,676 | $16,900 | $0 | $0 |
| 2019 | $1,676 | $16,900 | $0 | $0 |
| 2018 | $1,680 | $16,900 | $2,920 | $13,980 |
| 2017 | $1,595 | $0 | $0 | $0 |
| 2016 | $1,597 | $0 | $0 | $0 |
| 2015 | $1,634 | $0 | $0 | $0 |
| 2014 | -- | $0 | $0 | $0 |
| 2013 | -- | $0 | $0 | $0 |
Source: Public Records
Map
Nearby Homes
- 45 Wildmeade Ct
- 248 Osprey Point
- 359 Osprey Point
- 2 Shadowmoor Ct
- 823 Greenwood Dr
- 864 River Bluff Rd
- 6113 Whitewater Dr
- 793 Big Pine Rd
- 1413 Wapoo Dr
- 710 W Martintown Rd
- 951 Campbellton Dr
- 982 Campbellton Dr
- 984 Campbellton Dr
- 1005 Campbellton Dr
- 2438 Deodara Dr
- 1826 Courtney Dr
- 5093 Anna Creek Way
- 1815 Mountside Dr
- 1818 Mountside Dr
- 1077 Dietrich Ln
- 343 River Wind Dr
- 363 River Wind Dr
- 346 River Wind Dr
- 358 River Wind Dr
- 331 River Wind Dr
- 381 River Wind Dr
- 334 River Wind Dr
- 370 River Wind Dr
- 618 Plantation Dr
- 323 River Wind Dr
- 318 River Wind Dr
- 382 River Wind Dr
- 196 River Wind Dr
- 186 River Wind Dr
- 174 River Wind Dr
- 495 Savannah Barony Dr
- Lot 16 Savannah Barony Dr
- 315 River Wind Dr
- 202 River Wind Dr
- 115 River Wind Dr
Your Personal Tour Guide
Ask me questions while you tour the home.