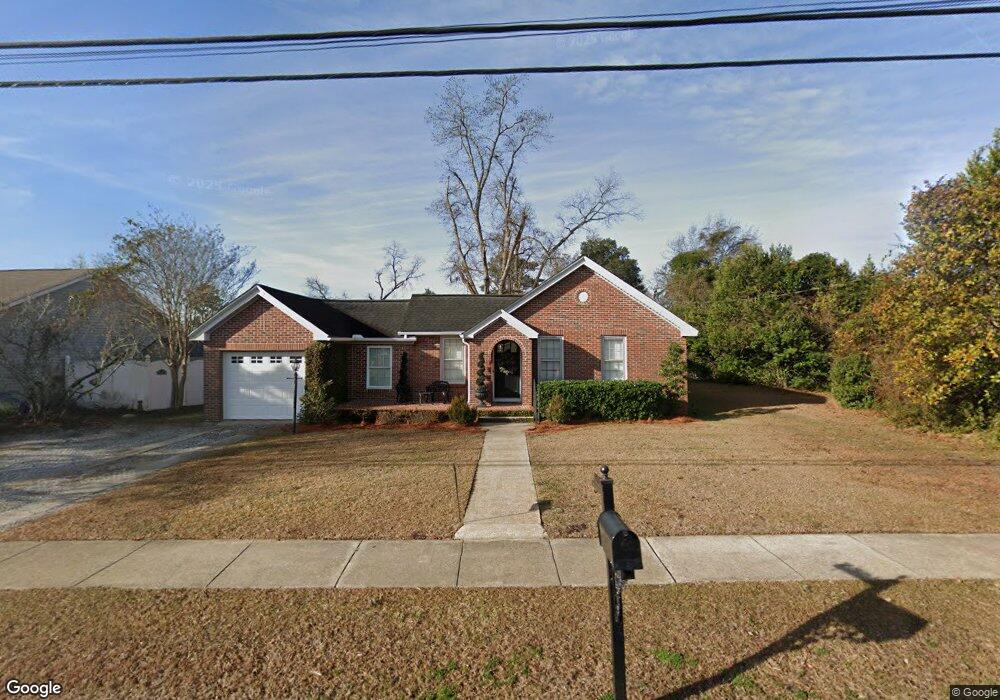
353 S 1st St Colquitt, GA 39837
Estimated Value: $146,000 - $154,250
3
Beds
2
Baths
1,570
Sq Ft
$96/Sq Ft
Est. Value
About This Home
This home is located at 353 S 1st St, Colquitt, GA 39837 and is currently estimated at $150,813, approximately $96 per square foot. 353 S 1st St is a home located in Miller County with nearby schools including Miller County Elementary School, Miller County Middle School, and Miller County High School.
Ownership History
Date
Name
Owned For
Owner Type
Purchase Details
Closed on
Apr 17, 2025
Sold by
Driver Bailey Wells
Bought by
Erneston Wendy Anne
Current Estimated Value
Home Financials for this Owner
Home Financials are based on the most recent Mortgage that was taken out on this home.
Original Mortgage
$148,191
Outstanding Balance
$146,103
Interest Rate
6.67%
Mortgage Type
New Conventional
Estimated Equity
$4,710
Purchase Details
Closed on
Jul 17, 2017
Sold by
Bryan Debra S
Bought by
Driver Jesse Dillon and Driver Bailey Wells
Home Financials for this Owner
Home Financials are based on the most recent Mortgage that was taken out on this home.
Original Mortgage
$90,000
Interest Rate
3.91%
Mortgage Type
New Conventional
Purchase Details
Closed on
Feb 4, 2005
Sold by
Bush Joseph O
Bought by
Bryan Debra S
Home Financials for this Owner
Home Financials are based on the most recent Mortgage that was taken out on this home.
Original Mortgage
$40,000
Interest Rate
5.12%
Mortgage Type
New Conventional
Purchase Details
Closed on
Mar 10, 2004
Sold by
Bush G E
Bought by
Thomley Edwina
Create a Home Valuation Report for This Property
The Home Valuation Report is an in-depth analysis detailing your home's value as well as a comparison with similar homes in the area
Home Values in the Area
Average Home Value in this Area
Purchase History
| Date | Buyer | Sale Price | Title Company |
|---|---|---|---|
| Erneston Wendy Anne | $155,000 | -- | |
| Driver Jesse Dillon | $90,000 | -- | |
| Bryan Debra S | $54,000 | -- | |
| Thomley Edwina | -- | -- |
Source: Public Records
Mortgage History
| Date | Status | Borrower | Loan Amount |
|---|---|---|---|
| Open | Erneston Wendy Anne | $148,191 | |
| Previous Owner | Driver Jesse Dillon | $90,000 | |
| Previous Owner | Bryan Debra S | $170,000 | |
| Previous Owner | Bryan Debra S | $50,000 | |
| Previous Owner | Heard Tomi Lynn | $14,659 | |
| Previous Owner | Bryan Debra S | $40,000 |
Source: Public Records
Tax History Compared to Growth
Tax History
| Year | Tax Paid | Tax Assessment Tax Assessment Total Assessment is a certain percentage of the fair market value that is determined by local assessors to be the total taxable value of land and additions on the property. | Land | Improvement |
|---|---|---|---|---|
| 2024 | $2,430 | $57,090 | $1,550 | $55,540 |
| 2023 | $1,591 | $35,688 | $1,550 | $34,138 |
| 2022 | $1,027 | $26,840 | $1,550 | $25,290 |
| 2021 | $1,016 | $26,840 | $1,550 | $25,290 |
| 2020 | $1,016 | $26,840 | $1,550 | $25,290 |
| 2019 | $1,019 | $26,840 | $1,550 | $25,290 |
| 2018 | $1,255 | $26,840 | $1,550 | $25,290 |
| 2017 | $1,033 | $22,087 | $1,550 | $20,537 |
| 2016 | $814 | $22,087 | $1,550 | $20,537 |
| 2015 | -- | $20,316 | $1,240 | $19,076 |
| 2014 | -- | $20,316 | $1,240 | $19,076 |
| 2013 | -- | $20,316 | $1,240 | $19,076 |
Source: Public Records
Map
Nearby Homes
- 102 Bremond St
- US 27 Us Highway 27
- 2835 Georgia 91
- 157 E Pine St
- 356 E Main St
- 210 N First St
- 570 E Pine St
- 300 N First St
- 708 E Crawford St
- 000 Thompson Town Rd
- 000 Phillipsburg Rd
- 721 E Crawford St
- 000 Bellview Rd
- 1203 Bellview Rd
- 113 Crooked Oak Ln
- 1502 Brinson Rd
- 745 Harmony Church Rd
- 1545 Phillipsburg Rd
- 1563 Ga Highway 27 N
- 430 Cox Rd
- 355 S 1st St
- 351 S 1st St
- 357 S 1st St
- 160 Peter St
- 357 S First St
- 359 S 1st St
- 159 E Crawford St
- E Crawford Street Hwy
- N U S 27
- 100 Bremond St
- 356 S Cuthbert St
- 354 S Cuthbert St
- 100 W Carr St
- 200 W Carr St
- 131/150 Us Highway 27
- 202 W Carr St
- 103 Bremond St
- 161 E Crawford St
- 358 S Cuthbert St
- 100 E Crawford St