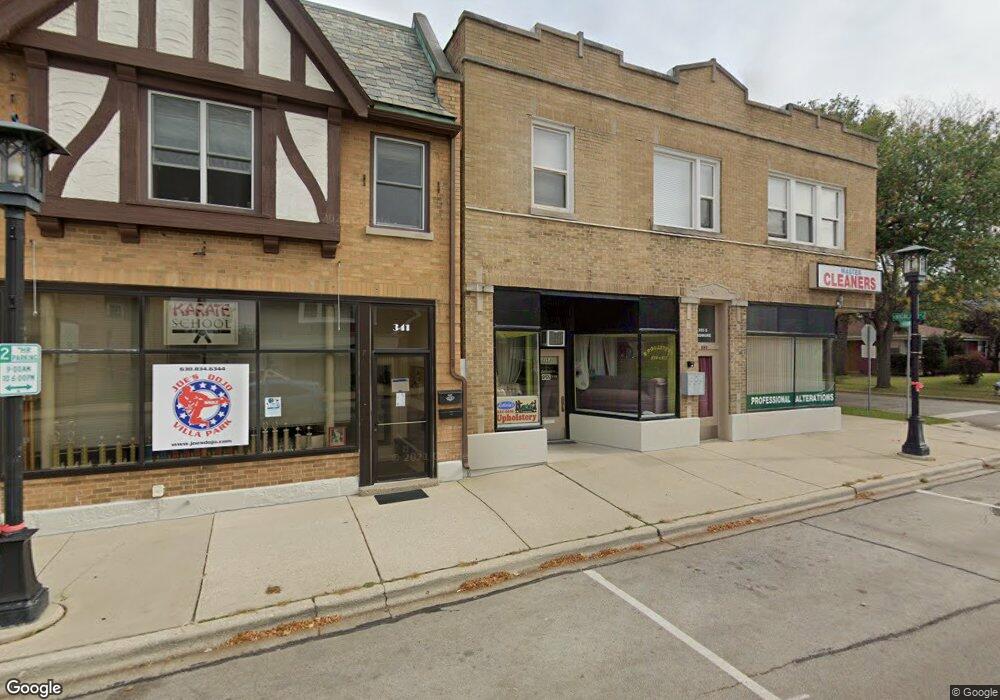
353 S Ardmore Ave Villa Park, IL 60181
Estimated Value: $849,160
--
Bed
--
Bath
--
Sq Ft
7,405
Sq Ft Lot
About This Home
This home is located at 353 S Ardmore Ave, Villa Park, IL 60181 and is currently estimated at $849,160. 353 S Ardmore Ave is a home located in DuPage County with nearby schools including Ardmore Elementary School, Jackson Middle School, and Willowbrook High School.
Ownership History
Date
Name
Owned For
Owner Type
Purchase Details
Closed on
Jan 30, 2020
Sold by
Klimson Robert S and Klimson Lee Anne
Bought by
Gentile Frank V
Current Estimated Value
Home Financials for this Owner
Home Financials are based on the most recent Mortgage that was taken out on this home.
Original Mortgage
$440,000
Outstanding Balance
$220,169
Interest Rate
4.75%
Mortgage Type
Commercial
Estimated Equity
$628,991
Purchase Details
Closed on
Apr 12, 2002
Sold by
Aim Ardmore Llc
Bought by
Klimson Robert J and Klimson Lee Anne
Home Financials for this Owner
Home Financials are based on the most recent Mortgage that was taken out on this home.
Original Mortgage
$368,000
Interest Rate
4.75%
Mortgage Type
Credit Line Revolving
Purchase Details
Closed on
Oct 1, 2001
Sold by
Firstar Bank Na
Bought by
Aim Ardmore Llc
Home Financials for this Owner
Home Financials are based on the most recent Mortgage that was taken out on this home.
Original Mortgage
$413,000
Interest Rate
8.25%
Mortgage Type
Commercial
Create a Home Valuation Report for This Property
The Home Valuation Report is an in-depth analysis detailing your home's value as well as a comparison with similar homes in the area
Home Values in the Area
Average Home Value in this Area
Purchase History
| Date | Buyer | Sale Price | Title Company |
|---|---|---|---|
| Gentile Frank V | $590,000 | Attorneys Ttl Guaranty Fund | |
| Klimson Robert J | $454,000 | -- | |
| Aim Ardmore Llc | $413,000 | Premier Title |
Source: Public Records
Mortgage History
| Date | Status | Borrower | Loan Amount |
|---|---|---|---|
| Open | Gentile Frank V | $440,000 | |
| Previous Owner | Klimson Robert J | $368,000 | |
| Previous Owner | Aim Ardmore Llc | $413,000 |
Source: Public Records
Tax History Compared to Growth
Tax History
| Year | Tax Paid | Tax Assessment Tax Assessment Total Assessment is a certain percentage of the fair market value that is determined by local assessors to be the total taxable value of land and additions on the property. | Land | Improvement |
|---|---|---|---|---|
| 2024 | $14,908 | $197,248 | $25,943 | $171,305 |
| 2023 | $14,243 | $181,900 | $23,990 | $157,910 |
| 2022 | $12,315 | $158,390 | $22,830 | $135,560 |
| 2021 | $13,278 | $173,330 | $22,260 | $151,070 |
| 2020 | $14,749 | $192,620 | $21,770 | $170,850 |
| 2019 | $15,576 | $206,470 | $20,700 | $185,770 |
| 2018 | $15,698 | $195,440 | $19,590 | $175,850 |
| 2017 | $15,377 | $186,240 | $40,750 | $145,490 |
| 2016 | $15,013 | $175,450 | $38,390 | $137,060 |
| 2015 | $14,889 | $163,450 | $35,760 | $127,690 |
| 2014 | $13,992 | $154,200 | $33,740 | $120,460 |
| 2013 | $13,320 | $156,380 | $34,220 | $122,160 |
Source: Public Records
Map
Nearby Homes
- 194 Washington St
- 5 E Washington St
- 114 E Kenilworth Ave
- 1 S 215 Stratford Ln
- 604 S Grant Ave
- 316 E Highland Ave
- 530 E Highland Ave Unit A2
- 1041 E Division St
- 639 S Oakland Ave
- 1136 E Kenilworth Ave
- 835 S Wisconsin Ave
- 727 S Oakland Ave
- 409 W Madison St
- 235 N Ardmore Ave
- 37 N Addison Rd
- 247 N Ardmore Ave
- 928 S Michigan Ave
- 326 W Adams St
- 1150 E Jackson St Unit 1A
- 935 E Saint Charles Rd
- 341 S Ardmore Ave
- 337 S Ardmore Ave Unit 2F
- 337 S Ardmore Ave
- 335 Ardmore Ave
- 403 S Ardmore Ave
- 333 S Ardmore Ave
- 15 E Highland Ave
- 407 S Ardmore Ave
- 331 S Ardmore Ave
- 340 S Cornell Ave
- 411 S Ardmore Ave
- 404 S Ardmore Ave
- 7 E Park Blvd Unit 1
- 410 S Cornell Ave
- 9 E Park Blvd Unit 1
- 9 E Park Blvd
- 336 S Cornell Ave
- 327 S Ardmore Ave
- 415 S Ardmore Ave
- 5 W Park Blvd