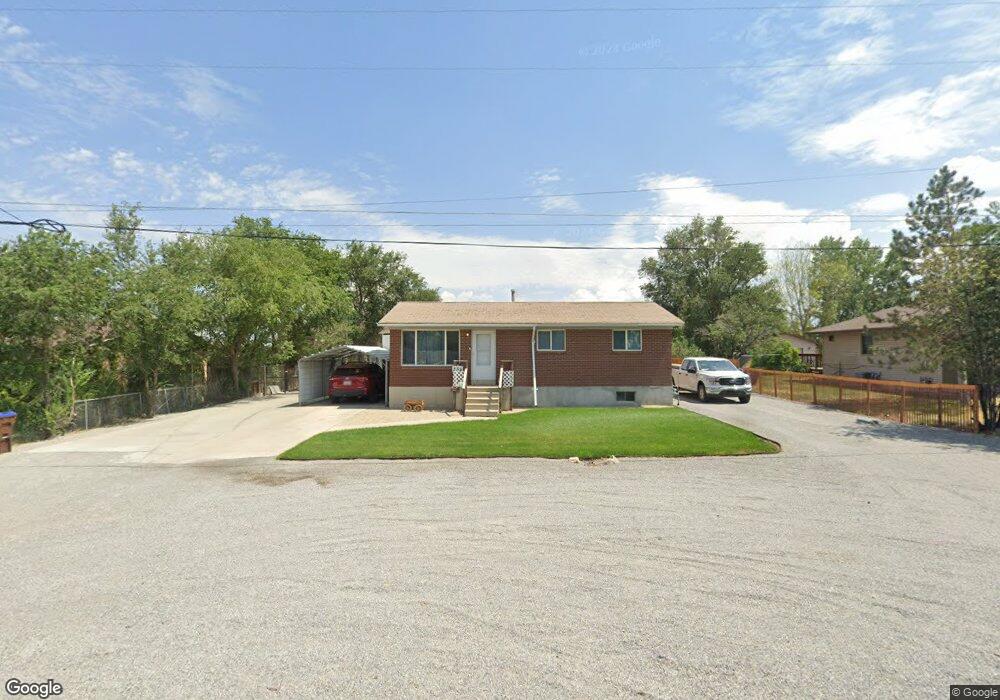
353 S Cooley St Grantsville, UT 84029
Estimated Value: $394,000 - $436,000
3
Beds
1
Bath
1,824
Sq Ft
$227/Sq Ft
Est. Value
About This Home
This home is located at 353 S Cooley St, Grantsville, UT 84029 and is currently estimated at $414,899, approximately $227 per square foot. 353 S Cooley St is a home located in Tooele County with nearby schools including Grantsville Elementary School, Grantsville Junior High School, and Grantsville High School.
Ownership History
Date
Name
Owned For
Owner Type
Purchase Details
Closed on
Apr 24, 2023
Sold by
Walk Mitch C
Bought by
Christensen Chuck R and Christensen Sandy L
Current Estimated Value
Purchase Details
Closed on
Jun 25, 2012
Sold by
Walk Mitch C and Walk Diana L
Bought by
Walk Mitch C
Home Financials for this Owner
Home Financials are based on the most recent Mortgage that was taken out on this home.
Original Mortgage
$135,698
Interest Rate
3.87%
Mortgage Type
FHA
Purchase Details
Closed on
May 21, 2009
Sold by
Walk Mitch C
Bought by
Walk Mitch C and Walk Diana L
Home Financials for this Owner
Home Financials are based on the most recent Mortgage that was taken out on this home.
Original Mortgage
$123,627
Interest Rate
4.78%
Mortgage Type
FHA
Purchase Details
Closed on
May 29, 2008
Sold by
Walk Mitch C
Bought by
Walk Mitch C and Walk Diana L
Home Financials for this Owner
Home Financials are based on the most recent Mortgage that was taken out on this home.
Original Mortgage
$121,800
Interest Rate
6.05%
Mortgage Type
FHA
Create a Home Valuation Report for This Property
The Home Valuation Report is an in-depth analysis detailing your home's value as well as a comparison with similar homes in the area
Purchase History
| Date | Buyer | Sale Price | Title Company |
|---|---|---|---|
| Christensen Chuck R | -- | Security Title | |
| Walk Mitch C | -- | Meridian Title Company | |
| Walk Mitch C | -- | First American Title Ins | |
| Walk Mitch C | -- | First American Title Ins | |
| Walk Mitch C | -- | Equity Title | |
| Walk Mitch C | -- | Equity Title |
Source: Public Records
Mortgage History
| Date | Status | Borrower | Loan Amount |
|---|---|---|---|
| Previous Owner | Walk Mitch C | $135,698 | |
| Previous Owner | Walk Mitch C | $123,627 | |
| Previous Owner | Walk Mitch C | $121,800 |
Source: Public Records
Tax History
| Year | Tax Paid | Tax Assessment Tax Assessment Total Assessment is a certain percentage of the fair market value that is determined by local assessors to be the total taxable value of land and additions on the property. | Land | Improvement |
|---|---|---|---|---|
| 2025 | $2,543 | $413,704 | $202,700 | $211,004 |
| 2024 | $2,489 | $203,244 | $112,700 | $90,544 |
| 2023 | $2,489 | $186,286 | $77,050 | $109,236 |
| 2022 | $2,202 | $202,669 | $88,875 | $113,794 |
| 2021 | $1,635 | $122,756 | $54,500 | $68,256 |
| 2020 | $1,652 | $216,416 | $97,250 | $119,166 |
| 2019 | $1,426 | $182,560 | $66,800 | $115,760 |
| 2018 | $1,355 | $163,267 | $66,800 | $96,467 |
| 2017 | $1,153 | $147,189 | $66,800 | $80,389 |
| 2016 | $1,126 | $77,745 | $37,550 | $40,195 |
| 2015 | $1,126 | $77,745 | $0 | $0 |
| 2014 | -- | $51,845 | $0 | $0 |
Source: Public Records
Map
Nearby Homes
- 796 W Cherry Orchard Ln
- 356 S Center St
- 346 W Durfee St
- 230 S West St Unit 2
- 511 W Trejo Ridge Cir
- 431 W Cherry St
- 463 S Trejo Ridge Rd
- 464 S Trejo Ridge Rd
- 414 W Domain Ln
- 503 W Independence St Unit 211
- 159 S Freedom Way Unit 213
- 582 W Durfee St
- 278 W Williams Ln
- 325 W Peach St
- 214 W Williams Ln
- 531 S Hale St
- 573 S Maxwell Dr
- 128 S Freedom Way Unit 219
- 562 W Coyote Ridge Rd
- 145 S Liberty St Unit 223
- 359 S Cooley St
- 347 S Cooley St
- 372 S Cooley St
- 366 S Cooley St
- 341 S Cooley St
- 365 S Cooley St
- 310 Belaire Cir
- 354 S Cooley St
- 307 Belaire Cir
- 331 S Cooley St
- 367 Severe St
- 344 S Cooley St
- 375 Severe St
- 315 Belaire Cir
- 361 Severe St
- 392 S Cooley St
- 361 S Severe St
- 375 S Cooley St
- 321 Belaire Cir
- 336 S Cooley St
Your Personal Tour Guide
Ask me questions while you tour the home.