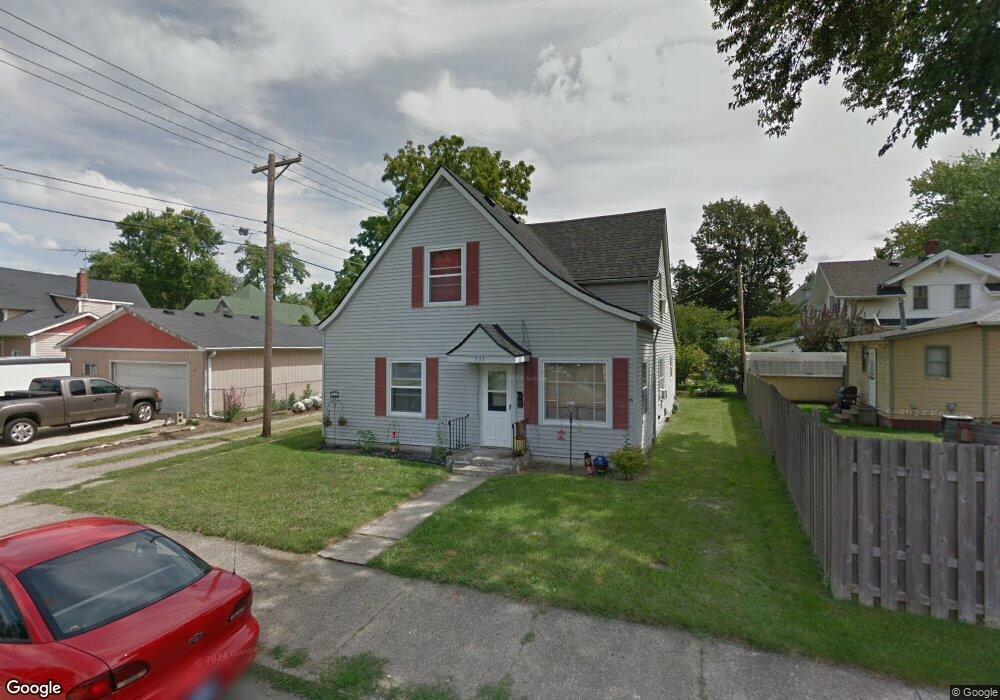
353 S East St Frankfort, IN 46041
Estimated Value: $74,000 - $184,000
3
Beds
2
Baths
2,016
Sq Ft
$72/Sq Ft
Est. Value
About This Home
This home is located at 353 S East St, Frankfort, IN 46041 and is currently estimated at $145,959, approximately $72 per square foot. 353 S East St is a home located in Clinton County with nearby schools including Frankfort Senior High School and Frankfort Covenant Academy.
Ownership History
Date
Name
Owned For
Owner Type
Purchase Details
Closed on
Jan 24, 2023
Sold by
Cunningham Lindsey R Le
Bought by
Jl Cunningham Properties Llc
Current Estimated Value
Purchase Details
Closed on
Nov 12, 2020
Sold by
Lmch Rentals Llc
Bought by
Cunningham John R and Cunningham Lindsey R
Home Financials for this Owner
Home Financials are based on the most recent Mortgage that was taken out on this home.
Original Mortgage
$75,000
Interest Rate
2.8%
Mortgage Type
New Conventional
Purchase Details
Closed on
Apr 16, 2019
Sold by
Mullen Laura E
Bought by
Lmch Rentals Llc
Home Financials for this Owner
Home Financials are based on the most recent Mortgage that was taken out on this home.
Original Mortgage
$44,250
Interest Rate
4.4%
Mortgage Type
New Conventional
Purchase Details
Closed on
Feb 15, 2019
Sold by
Taylor Jack L and Taylor Shirly A
Bought by
Mullen Laura E
Home Financials for this Owner
Home Financials are based on the most recent Mortgage that was taken out on this home.
Original Mortgage
$44,250
Interest Rate
4.4%
Mortgage Type
New Conventional
Create a Home Valuation Report for This Property
The Home Valuation Report is an in-depth analysis detailing your home's value as well as a comparison with similar homes in the area
Home Values in the Area
Average Home Value in this Area
Purchase History
| Date | Buyer | Sale Price | Title Company |
|---|---|---|---|
| Jl Cunningham Properties Llc | -- | None Listed On Document | |
| Cunningham John R | -- | None Available | |
| Lmch Rentals Llc | -- | None Available | |
| Mullen Laura E | -- | Meridian Title |
Source: Public Records
Mortgage History
| Date | Status | Borrower | Loan Amount |
|---|---|---|---|
| Previous Owner | Cunningham John R | $75,000 | |
| Previous Owner | Mullen Laura E | $44,250 |
Source: Public Records
Tax History Compared to Growth
Tax History
| Year | Tax Paid | Tax Assessment Tax Assessment Total Assessment is a certain percentage of the fair market value that is determined by local assessors to be the total taxable value of land and additions on the property. | Land | Improvement |
|---|---|---|---|---|
| 2024 | $2,134 | $94,500 | $8,100 | $86,400 |
| 2023 | $2,052 | $89,300 | $8,100 | $81,200 |
| 2022 | $1,864 | $81,600 | $8,100 | $73,500 |
| 2021 | $1,050 | $45,500 | $8,100 | $37,400 |
| 2020 | $1,078 | $45,500 | $8,100 | $37,400 |
| 2019 | $1,079 | $45,500 | $8,100 | $37,400 |
| 2018 | $1,068 | $45,500 | $8,100 | $37,400 |
| 2017 | $1,122 | $47,300 | $7,500 | $39,800 |
| 2016 | $1,061 | $47,800 | $7,500 | $40,300 |
| 2014 | $950 | $47,500 | $7,500 | $40,000 |
Source: Public Records
Map
Nearby Homes
- 557 E Boone St
- 508 Glendale Dr
- 1058 E South St
- 1079 E Wabash St
- 1105 E Wabash St
- 1209 E Wabash St
- 1106 E South St
- 255 N East St
- 0 State Rd
- --- State Rd
- 458 S Jackson St
- 901 Harvard Terrace
- 353 Harvard Terrace
- 652 S Jackson St
- 1352 E Wabash St
- 820 Hackberry Ct
- 1306 E Washington St
- 862 S Jackson St
- 258 Main Ave Unit 1-8
- 840 S Hoke Ave
- 702 E South St
- 708 E South St
- 701 E Wabash St
- 709 E Wabash St
- 658 E South St
- 752 E South St
- 659 E Wabash St
- 656 E South St
- 751 E Wabash St
- 655 E Wabash St
- 758 E South St
- 701 E South St
- 652 E South St
- 709 E South St
- 757 E Wabash St
- 651 E Wabash St
- 659 E South St
- 657 E South St
- 751 E South St
- 700 E Wabash St