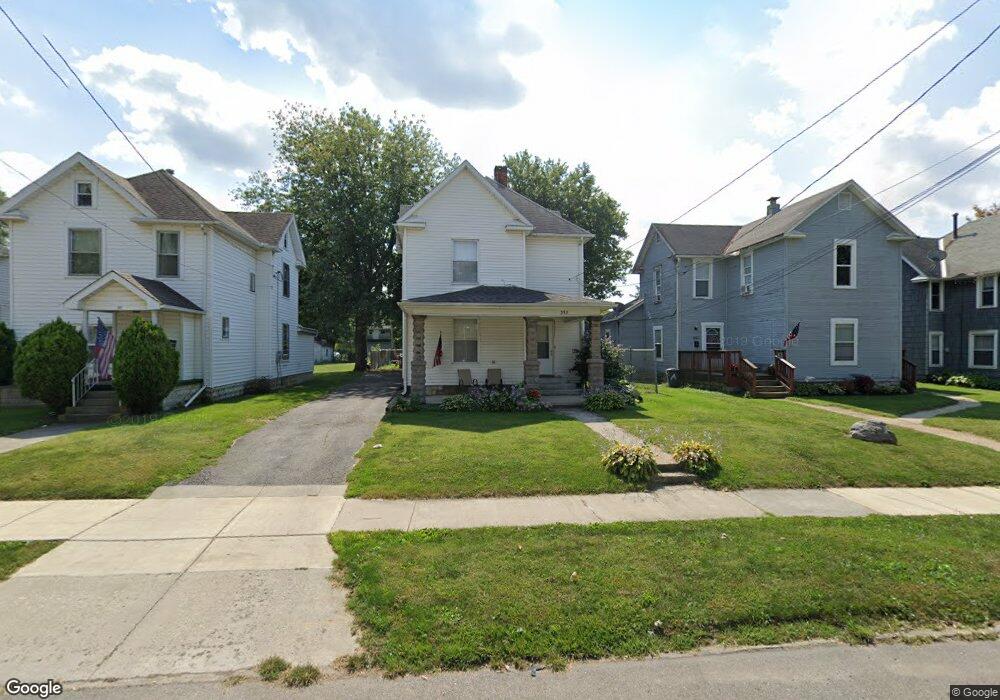
353 Silver St Marion, OH 43302
Estimated Value: $88,000 - $118,000
2
Beds
1
Bath
1,666
Sq Ft
$62/Sq Ft
Est. Value
About This Home
This home is located at 353 Silver St, Marion, OH 43302 and is currently estimated at $103,870, approximately $62 per square foot. 353 Silver St is a home located in Marion County with nearby schools including Rutherford B. Hayes Elementary School, Ulysses S. Grant Middle School, and Harding High School.
Ownership History
Date
Name
Owned For
Owner Type
Purchase Details
Closed on
Oct 13, 2022
Sold by
Mcgrail Gretta and Mcgrail Scott G
Bought by
Clase Ty C and Clase Laura R
Current Estimated Value
Purchase Details
Closed on
Mar 21, 2007
Sold by
Daniel Charles
Bought by
Daniel Gretta and Daniel Gretta A
Home Financials for this Owner
Home Financials are based on the most recent Mortgage that was taken out on this home.
Original Mortgage
$49,000
Interest Rate
6.31%
Mortgage Type
Unknown
Create a Home Valuation Report for This Property
The Home Valuation Report is an in-depth analysis detailing your home's value as well as a comparison with similar homes in the area
Home Values in the Area
Average Home Value in this Area
Purchase History
| Date | Buyer | Sale Price | Title Company |
|---|---|---|---|
| Clase Ty C | -- | -- | |
| Clase Ty C | -- | None Listed On Document | |
| Daniel Gretta | -- | Eagle Title Llc |
Source: Public Records
Mortgage History
| Date | Status | Borrower | Loan Amount |
|---|---|---|---|
| Previous Owner | Daniel Gretta | $49,000 |
Source: Public Records
Tax History
| Year | Tax Paid | Tax Assessment Tax Assessment Total Assessment is a certain percentage of the fair market value that is determined by local assessors to be the total taxable value of land and additions on the property. | Land | Improvement |
|---|---|---|---|---|
| 2025 | $930 | $32,780 | $1,750 | $31,030 |
| 2024 | $930 | $24,230 | $1,690 | $22,540 |
| 2023 | $930 | $24,230 | $1,690 | $22,540 |
| 2022 | $864 | $24,230 | $1,690 | $22,540 |
| 2021 | $745 | $18,810 | $1,470 | $17,340 |
| 2020 | $747 | $18,810 | $1,470 | $17,340 |
| 2019 | $726 | $18,810 | $1,470 | $17,340 |
| 2018 | $793 | $20,570 | $1,440 | $19,130 |
| 2017 | $804 | $20,570 | $1,440 | $19,130 |
| 2016 | $798 | $20,570 | $1,440 | $19,130 |
| 2015 | $812 | $20,460 | $1,370 | $19,090 |
| 2014 | $841 | $20,460 | $1,370 | $19,090 |
| 2012 | $1,036 | $25,900 | $1,450 | $24,450 |
Source: Public Records
Map
Nearby Homes
- 343 Commercial St
- 438 N Prospect St Unit 434
- 324 W Church St
- 138 Park Blvd
- 230 Edwards St
- 532 N Prospect St
- 199 Olney Ave
- 552 N Prospect St
- 531 N Main St
- 434 N State St
- 374 Nunin Ct
- 636 Oak St
- 245 Park Blvd
- 641 Blake Ave
- 302 Blaine Ave
- 321 W Columbia St
- 313 Windsor St
- 212 Short St
- 229 W Columbia St
- 414 Thompson St
- 347 Silver St
- 357 Silver St
- 341 Silver 341 1/2 St
- 365 Silver St
- 291 Maple St
- 371 Silver St
- 289 Maple St Unit 291
- 354 Chestnut St
- 360 Chestnut St
- 327 Silver St
- 348 Silver St
- 366 Chestnut St
- 342 Silver St
- 346 Chestnut St
- 340 Chestnut St Unit 342
- 379 Silver St
- 321 Silver St
- 374 Chestnut St
- 360 Silver St
- 336 Silver St
Your Personal Tour Guide
Ask me questions while you tour the home.