Estimated Value: $220,972 - $250,000
3
Beds
2
Baths
1,295
Sq Ft
$181/Sq Ft
Est. Value
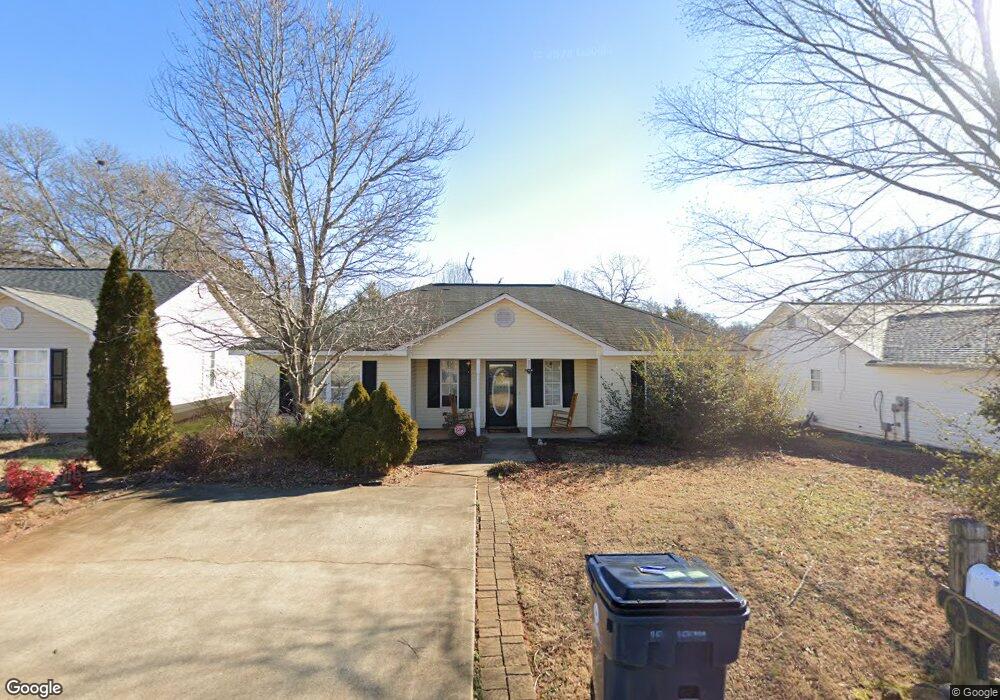
About This Home
This home is located at 353 Split Oak Ln, Inman, SC 29349 and is currently estimated at $233,993, approximately $180 per square foot. 353 Split Oak Ln is a home located in Spartanburg County with nearby schools including James H. Hendrix Elementary School, Boiling Springs Middle School, and Boiling Springs High School.
Ownership History
Date
Name
Owned For
Owner Type
Purchase Details
Closed on
Dec 8, 2017
Sold by
Gary Carolyn F and Gary Sylvester
Bought by
Gary Carolyn F
Current Estimated Value
Purchase Details
Closed on
Jun 20, 2012
Sold by
Hastie Steven G and Hastie Carol A
Bought by
Gary Sylvester and Gary Carolyn
Home Financials for this Owner
Home Financials are based on the most recent Mortgage that was taken out on this home.
Original Mortgage
$103,061
Outstanding Balance
$70,935
Interest Rate
3.76%
Mortgage Type
Future Advance Clause Open End Mortgage
Estimated Equity
$163,058
Purchase Details
Closed on
Dec 1, 2005
Sold by
Billings Construction Inc
Bought by
Hastie Steven G and Hastie Carol A
Home Financials for this Owner
Home Financials are based on the most recent Mortgage that was taken out on this home.
Original Mortgage
$14,701
Interest Rate
6.23%
Mortgage Type
Stand Alone Second
Purchase Details
Closed on
Jul 21, 2004
Sold by
Woodscreek At Inman Llc
Bought by
Billings Construction Inc
Create a Home Valuation Report for This Property
The Home Valuation Report is an in-depth analysis detailing your home's value as well as a comparison with similar homes in the area
Home Values in the Area
Average Home Value in this Area
Purchase History
| Date | Buyer | Sale Price | Title Company |
|---|---|---|---|
| Gary Carolyn F | -- | None Available | |
| Gary Sylvester | $101,000 | -- | |
| Hastie Steven G | $98,010 | -- | |
| Hastie Steven G | $98,010 | -- | |
| Billings Construction Inc | $18,500 | -- |
Source: Public Records
Mortgage History
| Date | Status | Borrower | Loan Amount |
|---|---|---|---|
| Open | Gary Sylvester | $103,061 | |
| Previous Owner | Hastie Steven G | $14,701 | |
| Previous Owner | Hastie Steven G | $78,408 |
Source: Public Records
Tax History
| Year | Tax Paid | Tax Assessment Tax Assessment Total Assessment is a certain percentage of the fair market value that is determined by local assessors to be the total taxable value of land and additions on the property. | Land | Improvement |
|---|---|---|---|---|
| 2022 | $636 | $4,586 | $878 | $3,708 |
| 2021 | $623 | $4,586 | $878 | $3,708 |
| 2020 | $604 | $4,586 | $878 | $3,708 |
| 2019 | $612 | $4,586 | $878 | $3,708 |
| 2018 | $594 | $4,586 | $878 | $3,708 |
| 2017 | $457 | $3,988 | $800 | $3,188 |
| 2016 | $443 | $3,988 | $800 | $3,188 |
| 2015 | $438 | $3,988 | $800 | $3,188 |
| 2014 | $420 | $3,988 | $800 | $3,188 |
Source: Public Records
Map
Nearby Homes
- 361 Split Oak Ln
- 381 Split Oak Ln
- 393 Split Oak Ln
- 834 John Weaver Trace
- 430 Bud Farmer Place
- 105 Everest Dr
- 107 Everest Dr
- 108 Everest Dr
- 224 W Clark Rd
- 603 Ezra Ct
- 1763 Watersail Ln
- 203 Vega St
- 505 Treasure Cove
- 416 Pisgah Ln
- 1304 Dockyard Ln
- 1304 Dockyard Ln Unit CLE 83
- 1295 Dockyard Ln Unit CLE 77
- 1295 Dockyard Ln
- 72 Blackstock Rd
- 422 Mount Hood Dr
- 357 Split Oak Ln
- 349 Split Oak Ln
- 345 Split Oak Ln
- 352 Split Oak Ln
- 356 Split Oak Ln
- 348 Split Oak Ln
- 365 Split Oak Ln
- 341 Split Oak Ln
- 360 Split Oak Ln
- 360 Split Oak Ln Unit Inman
- 342 Split Oak Ln
- 364 Split Oak Ln
- 337 Split Oak Ln
- 369 Split Oak Ln
- 535 Nature Walk Way
- 368 Split Oak Ln
- 541 Nature Walk Way
- 523 Nature Walk Way
- 333 Split Oak Ln
- 373 Split Oak Ln
Your Personal Tour Guide
Ask me questions while you tour the home.