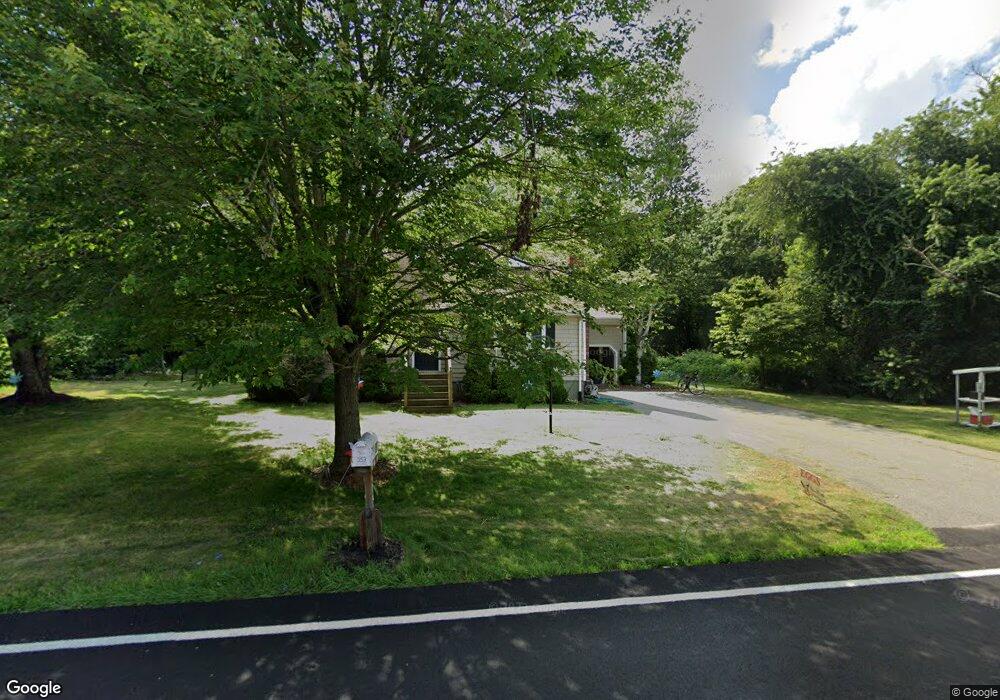
353 Tickle Rd Westport, MA 02790
North Westport NeighborhoodEstimated Value: $577,866 - $768,000
4
Beds
2
Baths
1,764
Sq Ft
$373/Sq Ft
Est. Value
About This Home
This home is located at 353 Tickle Rd, Westport, MA 02790 and is currently estimated at $657,717, approximately $372 per square foot. 353 Tickle Rd is a home located in Bristol County with nearby schools including Alice A. Macomber Primary School, Westport Elementary School, and Westport Middle-High School.
Ownership History
Date
Name
Owned For
Owner Type
Purchase Details
Closed on
Jan 17, 2018
Sold by
Gaboury Andrew R and Gaboury Lisa
Bought by
Gaboury Lisa
Current Estimated Value
Purchase Details
Closed on
Nov 22, 2010
Sold by
Roy Jeffrey R and Jackson Christy
Bought by
Gaboury Andrew R and Gaboury Lisa
Home Financials for this Owner
Home Financials are based on the most recent Mortgage that was taken out on this home.
Original Mortgage
$283,500
Interest Rate
4.3%
Mortgage Type
Purchase Money Mortgage
Purchase Details
Closed on
Dec 20, 2004
Sold by
Hampl Margaret and Hampl William S
Bought by
Roy Jeffrey R and Jackson Christy
Home Financials for this Owner
Home Financials are based on the most recent Mortgage that was taken out on this home.
Original Mortgage
$255,000
Interest Rate
5.68%
Mortgage Type
Purchase Money Mortgage
Create a Home Valuation Report for This Property
The Home Valuation Report is an in-depth analysis detailing your home's value as well as a comparison with similar homes in the area
Home Values in the Area
Average Home Value in this Area
Purchase History
| Date | Buyer | Sale Price | Title Company |
|---|---|---|---|
| Gaboury Lisa | -- | -- | |
| Gaboury Andrew R | $315,000 | -- | |
| Roy Jeffrey R | $355,000 | -- |
Source: Public Records
Mortgage History
| Date | Status | Borrower | Loan Amount |
|---|---|---|---|
| Previous Owner | Roy Jeffrey R | $283,500 | |
| Previous Owner | Roy Jeffrey R | $240,000 | |
| Previous Owner | Roy Jeffrey R | $255,000 | |
| Previous Owner | Roy Jeffrey R | $10,000 |
Source: Public Records
Tax History Compared to Growth
Tax History
| Year | Tax Paid | Tax Assessment Tax Assessment Total Assessment is a certain percentage of the fair market value that is determined by local assessors to be the total taxable value of land and additions on the property. | Land | Improvement |
|---|---|---|---|---|
| 2025 | $3,759 | $504,500 | $175,900 | $328,600 |
| 2024 | $3,587 | $464,000 | $162,900 | $301,100 |
| 2023 | $3,585 | $439,300 | $142,800 | $296,500 |
| 2022 | $3,121 | $396,700 | $142,800 | $253,900 |
| 2021 | $3,121 | $362,100 | $129,800 | $232,300 |
| 2020 | $3,009 | $356,900 | $124,600 | $232,300 |
| 2019 | $2,762 | $334,000 | $108,400 | $225,600 |
| 2018 | $2,365 | $289,500 | $116,600 | $172,900 |
| 2017 | $2,359 | $296,000 | $116,600 | $179,400 |
| 2016 | $2,341 | $296,000 | $116,600 | $179,400 |
| 2015 | $2,164 | $272,900 | $116,600 | $156,300 |
Source: Public Records
Map
Nearby Homes
- 33 Moniz Dr
- 51 Newton St
- 40 Robert St
- 219 Tickle Rd
- 0 Tickle Rd Unit 73453134
- 218 American Legion Hwy
- 100 Cory's Ln
- 47 Devol Ave
- 8 Campion Ave
- 100 Corys Ln
- 14 Glendale Ave
- 1125 Stafford Rd Unit 5
- 47 Robert St
- 75 Montgomery St
- 0 Crandall Rd
- 771 Sanford Rd
- 308 Robert St
- 6 Angel Ct
- 374 Crandall Rd
- 447 Stafford Rd Unit E7