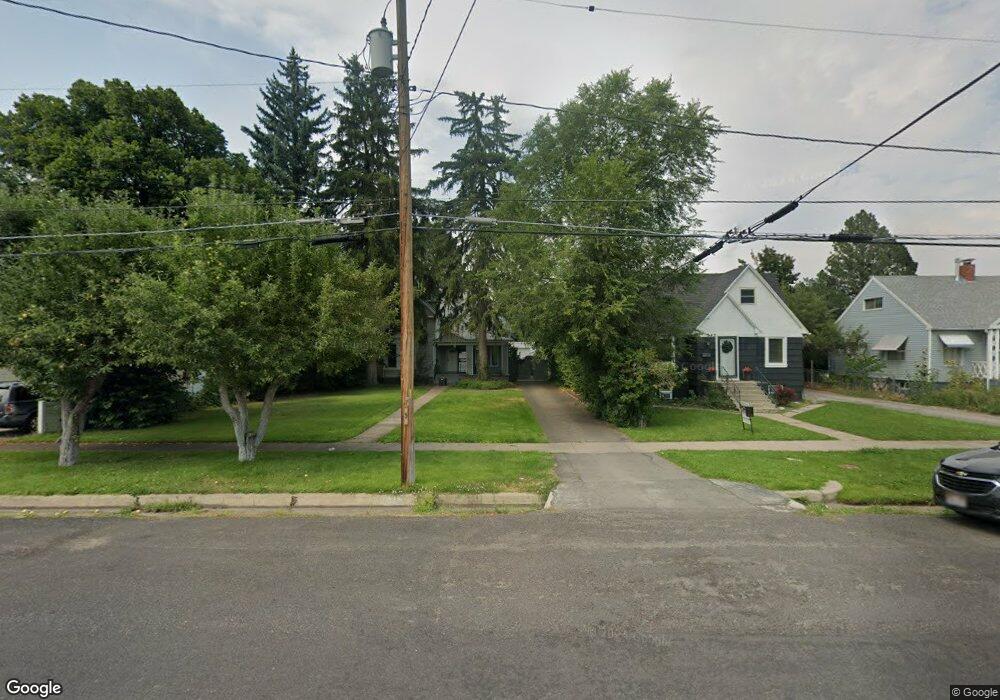
353 W 100 N Logan, UT 84321
Ellis NeighborhoodEstimated Value: $483,000 - $503,048
7
Beds
3
Baths
3,298
Sq Ft
$149/Sq Ft
Est. Value
About This Home
This home is located at 353 W 100 N, Logan, UT 84321 and is currently estimated at $492,262, approximately $149 per square foot. 353 W 100 N is a home located in Cache County with nearby schools including Ellis School, Mount Logan Middle School, and Logan High School.
Ownership History
Date
Name
Owned For
Owner Type
Purchase Details
Closed on
Mar 30, 2020
Sold by
Kerkmann Barbara C and Barbara C Kerkmann Trust
Bought by
Petersen Jason and Petersen Penny
Current Estimated Value
Home Financials for this Owner
Home Financials are based on the most recent Mortgage that was taken out on this home.
Original Mortgage
$236,250
Outstanding Balance
$161,997
Interest Rate
3.4%
Mortgage Type
New Conventional
Estimated Equity
$330,265
Purchase Details
Closed on
Jan 9, 2020
Sold by
Kerkmann Barbara C and The Kerkmann Family Trust
Bought by
Kerkmann Barbara C and The Barbara C Kerkmann Trust
Create a Home Valuation Report for This Property
The Home Valuation Report is an in-depth analysis detailing your home's value as well as a comparison with similar homes in the area
Home Values in the Area
Average Home Value in this Area
Purchase History
| Date | Buyer | Sale Price | Title Company |
|---|---|---|---|
| Petersen Jason | -- | Hickman Land Title Co | |
| Kerkmann Barbara C | -- | Hickman Land Title Co |
Source: Public Records
Mortgage History
| Date | Status | Borrower | Loan Amount |
|---|---|---|---|
| Open | Petersen Jason | $236,250 |
Source: Public Records
Tax History
| Year | Tax Paid | Tax Assessment Tax Assessment Total Assessment is a certain percentage of the fair market value that is determined by local assessors to be the total taxable value of land and additions on the property. | Land | Improvement |
|---|---|---|---|---|
| 2025 | $21 | $271,340 | $0 | $0 |
| 2024 | $2,163 | $270,965 | $0 | $0 |
| 2023 | $2,276 | $271,800 | $0 | $0 |
| 2022 | $1,980 | $220,715 | $0 | $0 |
| 2021 | $2,278 | $392,420 | $50,000 | $342,420 |
| 2020 | $2,022 | $313,400 | $50,000 | $263,400 |
| 2019 | $1,302 | $193,136 | $50,000 | $143,136 |
| 2018 | $1,313 | $177,800 | $50,000 | $127,800 |
| 2017 | $1,058 | $75,790 | $0 | $0 |
| 2016 | $1,097 | $75,790 | $0 | $0 |
| 2015 | $1,099 | $75,790 | $0 | $0 |
| 2014 | $993 | $75,790 | $0 | $0 |
| 2013 | -- | $75,790 | $0 | $0 |
Source: Public Records
Map
Nearby Homes
Your Personal Tour Guide
Ask me questions while you tour the home.