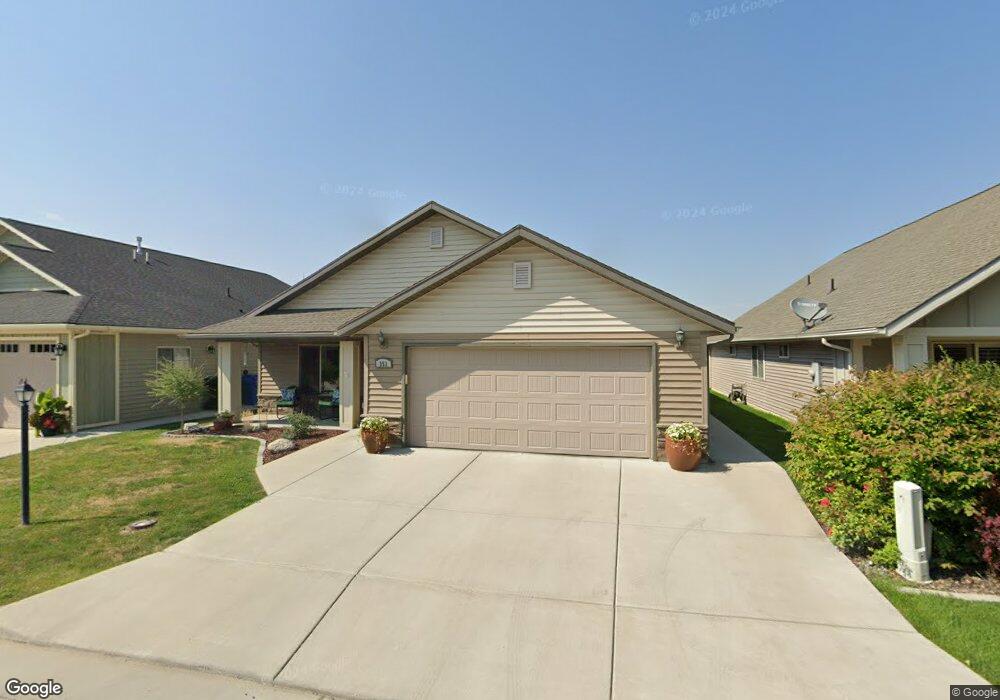
353 W 1530 N Logan, UT 84341
Bridger NeighborhoodEstimated Value: $395,668 - $526,000
2
Beds
2
Baths
1,327
Sq Ft
$329/Sq Ft
Est. Value
About This Home
This home is located at 353 W 1530 N, Logan, UT 84341 and is currently estimated at $436,667, approximately $329 per square foot. 353 W 1530 N is a home located in Cache County with nearby schools including Bridger School, Mount Logan Middle School, and Logan High School.
Ownership History
Date
Name
Owned For
Owner Type
Purchase Details
Closed on
Oct 24, 2023
Sold by
Fillmore Family Limited Partnership Fflp
Bought by
Werner Donald and Werner Carolyn
Current Estimated Value
Home Financials for this Owner
Home Financials are based on the most recent Mortgage that was taken out on this home.
Original Mortgage
$79,000
Outstanding Balance
$77,392
Interest Rate
7.18%
Mortgage Type
New Conventional
Estimated Equity
$359,275
Purchase Details
Closed on
Feb 1, 2017
Sold by
Nyman Carvel and Nyman Sidney Mervil
Bought by
Fillmore Family Limited Partnership Llp
Purchase Details
Closed on
Jan 7, 2015
Sold by
Nyman Cordell
Bought by
Nyman Cordell and Nyman Carvel
Purchase Details
Closed on
Mar 25, 2013
Sold by
Champlin Development Inc
Bought by
Nyman Cordell
Purchase Details
Closed on
Oct 7, 2008
Sold by
C H Champlin Llc
Bought by
Champlin Development Inc
Create a Home Valuation Report for This Property
The Home Valuation Report is an in-depth analysis detailing your home's value as well as a comparison with similar homes in the area
Home Values in the Area
Average Home Value in this Area
Purchase History
| Date | Buyer | Sale Price | Title Company |
|---|---|---|---|
| Werner Donald | -- | Pinnacle Title | |
| Fillmore Family Limited Partnership Llp | -- | Northern Title Company | |
| Nyman Cordell | -- | Northern Title Company | |
| Nyman Cordell | -- | Northern Title Company | |
| Champlin Development Inc | -- | Northern Title Company |
Source: Public Records
Mortgage History
| Date | Status | Borrower | Loan Amount |
|---|---|---|---|
| Open | Werner Donald | $79,000 |
Source: Public Records
Tax History Compared to Growth
Tax History
| Year | Tax Paid | Tax Assessment Tax Assessment Total Assessment is a certain percentage of the fair market value that is determined by local assessors to be the total taxable value of land and additions on the property. | Land | Improvement |
|---|---|---|---|---|
| 2025 | $1,644 | $212,685 | $0 | $0 |
| 2024 | $1,698 | $212,685 | $0 | $0 |
| 2023 | $1,776 | $212,080 | $0 | $0 |
| 2022 | $1,902 | $212,080 | $0 | $0 |
| 2021 | $1,575 | $271,384 | $55,000 | $216,384 |
| 2020 | $1,569 | $243,160 | $55,000 | $188,160 |
| 2019 | $1,639 | $243,160 | $55,000 | $188,160 |
| 2018 | $1,536 | $208,000 | $40,000 | $168,000 |
| 2017 | $1,536 | $110,000 | $0 | $0 |
| 2016 | $1,593 | $92,125 | $0 | $0 |
| 2015 | $1,335 | $92,125 | $0 | $0 |
| 2014 | $1,207 | $92,125 | $0 | $0 |
| 2013 | -- | $50,630 | $0 | $0 |
Source: Public Records
Map
Nearby Homes
- 1515 N 450 W Unit 103
- 446 W 1595 N Unit 103
- 514 W 1490 N Unit 102
- 539 W 1465 N Unit 17-102
- 1492 N 565 W Unit 101
- 1584 N 565 W Unit 104
- 1565 N 565 W Unit 101
- 2 Somerset Place
- 1762 N 460 W Unit 103-10
- 559 W 1350 N Unit 41
- 60 Hampton Place
- 2200 N 220 W
- 85 Hampton Place
- 259 W 1800 N
- 1926 Lavender Loop Unit 6
- 490 W 1950 N Unit 27
- 1030 N 130 W Unit 100
- 239 E 1530 N
- 894 N 400 W
- 897 N 250 W