Estimated Value: $353,000 - $392,000
3
Beds
1
Bath
934
Sq Ft
$397/Sq Ft
Est. Value
About This Home
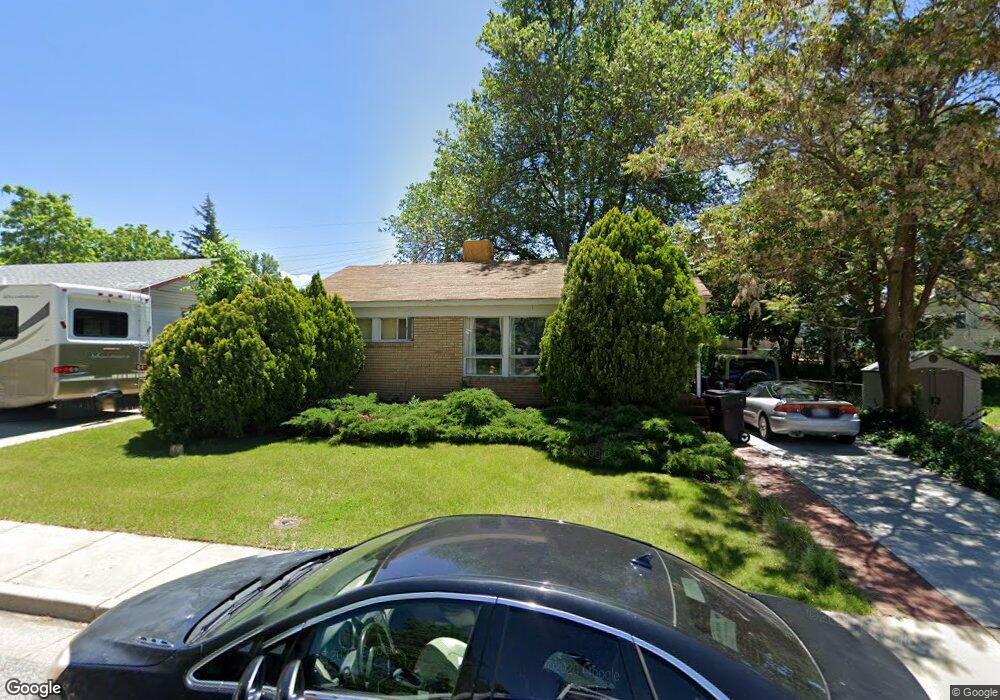
This home is located at 353 W 4725 S, Ogden, UT 84405 and is currently estimated at $370,563, approximately $396 per square foot. 353 W 4725 S is a home located in Weber County with nearby schools including Washington Terrace School, T.H. Bell Junior High School, and Bonneville High School.
Ownership History
Date
Name
Owned For
Owner Type
Purchase Details
Closed on
Aug 15, 2000
Sold by
Chambers Arta S and Lamb Arta S
Bought by
Rupe Julie
Current Estimated Value
Purchase Details
Closed on
May 4, 2000
Sold by
Lamb Joseph W and Lamb Arta S
Bought by
Rupe Julie
Home Financials for this Owner
Home Financials are based on the most recent Mortgage that was taken out on this home.
Original Mortgage
$98,824
Interest Rate
8.22%
Mortgage Type
FHA
Create a Home Valuation Report for This Property
The Home Valuation Report is an in-depth analysis detailing your home's value as well as a comparison with similar homes in the area
Home Values in the Area
Average Home Value in this Area
Purchase History
| Date | Buyer | Sale Price | Title Company |
|---|---|---|---|
| Rupe Julie | -- | Associated Title | |
| Rupe Julie | -- | Associated Title |
Source: Public Records
Mortgage History
| Date | Status | Borrower | Loan Amount |
|---|---|---|---|
| Previous Owner | Rupe Julie | $98,824 |
Source: Public Records
Tax History
| Year | Tax Paid | Tax Assessment Tax Assessment Total Assessment is a certain percentage of the fair market value that is determined by local assessors to be the total taxable value of land and additions on the property. | Land | Improvement |
|---|---|---|---|---|
| 2025 | $2,331 | $340,260 | $107,501 | $232,759 |
| 2024 | $2,209 | $181,499 | $59,125 | $122,374 |
| 2023 | $2,090 | $171,050 | $59,557 | $111,493 |
| 2022 | $2,200 | $188,100 | $56,893 | $131,207 |
| 2021 | $1,778 | $245,000 | $53,731 | $191,269 |
| 2020 | $1,743 | $220,000 | $44,011 | $175,989 |
| 2019 | $1,661 | $193,000 | $44,011 | $148,989 |
| 2018 | $1,458 | $164,000 | $44,011 | $119,989 |
| 2017 | $1,337 | $139,000 | $29,020 | $109,980 |
| 2016 | $1,187 | $66,153 | $16,232 | $49,921 |
| 2015 | $1,140 | $61,824 | $16,232 | $45,592 |
| 2014 | $1,110 | $59,603 | $16,232 | $43,371 |
Source: Public Records
Map
Nearby Homes