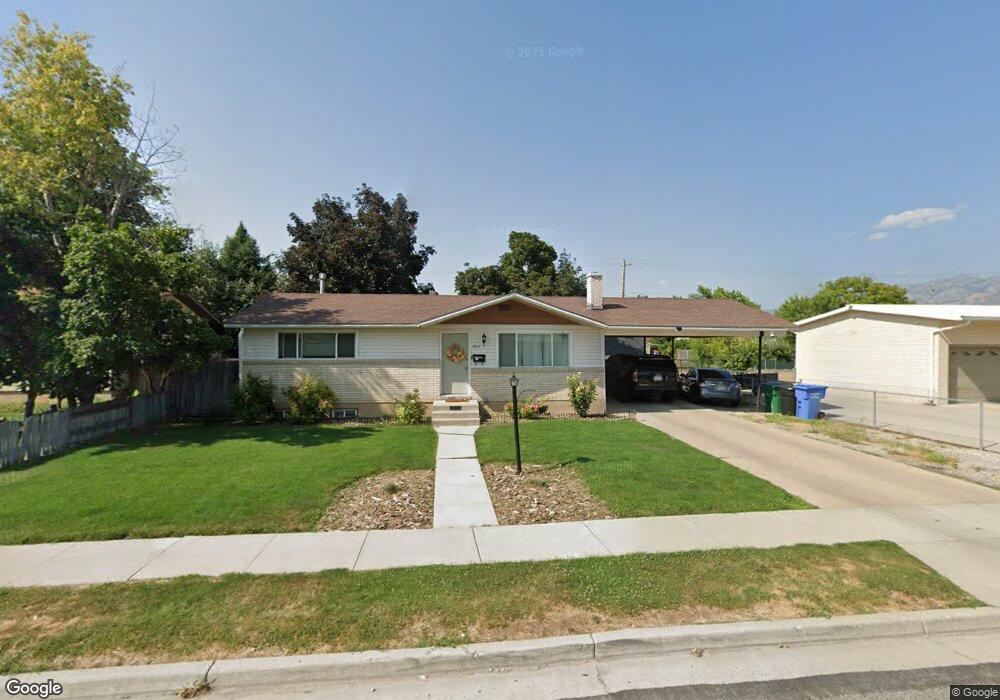
353 W 775 N Logan, UT 84321
Bridger NeighborhoodEstimated Value: $359,000 - $392,000
4
Beds
2
Baths
1,824
Sq Ft
$208/Sq Ft
Est. Value
About This Home
This home is located at 353 W 775 N, Logan, UT 84321 and is currently estimated at $379,640, approximately $208 per square foot. 353 W 775 N is a home located in Cache County with nearby schools including Bridger School, Mount Logan Middle School, and Logan High School.
Ownership History
Date
Name
Owned For
Owner Type
Purchase Details
Closed on
Aug 31, 2022
Sold by
Phillips Investment Properties Llc
Bought by
Swenson Tyson Brock and Swenson Mireya
Current Estimated Value
Home Financials for this Owner
Home Financials are based on the most recent Mortgage that was taken out on this home.
Original Mortgage
$358,338
Outstanding Balance
$341,745
Interest Rate
5.54%
Mortgage Type
FHA
Estimated Equity
$37,895
Purchase Details
Closed on
Sep 5, 2014
Sold by
Phillips Curt and Phillips Brooke
Bought by
Phillips Investment Properties Llc
Purchase Details
Closed on
Feb 4, 2013
Sold by
Callahan David and Callahan Denise
Bought by
Phillips Curt and Phillips Brooke
Home Financials for this Owner
Home Financials are based on the most recent Mortgage that was taken out on this home.
Original Mortgage
$88,500
Interest Rate
3.33%
Mortgage Type
New Conventional
Create a Home Valuation Report for This Property
The Home Valuation Report is an in-depth analysis detailing your home's value as well as a comparison with similar homes in the area
Home Values in the Area
Average Home Value in this Area
Purchase History
| Date | Buyer | Sale Price | Title Company |
|---|---|---|---|
| Swenson Tyson Brock | -- | None Listed On Document | |
| Phillips Investment Properties Llc | -- | Northern Title Company | |
| Phillips Curt | -- | American Secure Title Logan |
Source: Public Records
Mortgage History
| Date | Status | Borrower | Loan Amount |
|---|---|---|---|
| Open | Swenson Tyson Brock | $358,338 | |
| Previous Owner | Phillips Curt | $88,500 |
Source: Public Records
Tax History Compared to Growth
Tax History
| Year | Tax Paid | Tax Assessment Tax Assessment Total Assessment is a certain percentage of the fair market value that is determined by local assessors to be the total taxable value of land and additions on the property. | Land | Improvement |
|---|---|---|---|---|
| 2025 | $1,560 | $201,795 | $0 | $0 |
| 2024 | $1,611 | $201,795 | $0 | $0 |
| 2023 | $1,680 | $200,585 | $0 | $0 |
| 2022 | $1,606 | $179,020 | $0 | $0 |
| 2021 | $151 | $260,760 | $45,000 | $215,760 |
| 2020 | $1,450 | $224,800 | $45,000 | $179,800 |
| 2019 | $1,089 | $161,565 | $45,000 | $116,565 |
| 2018 | $1,062 | $143,784 | $45,000 | $98,784 |
| 2017 | $985 | $70,510 | $0 | $0 |
| 2016 | $1,021 | $70,510 | $0 | $0 |
| 2015 | $1,022 | $70,510 | $0 | $0 |
| 2014 | $910 | $69,440 | $0 | $0 |
| 2013 | -- | $69,440 | $0 | $0 |
Source: Public Records
Map
Nearby Homes