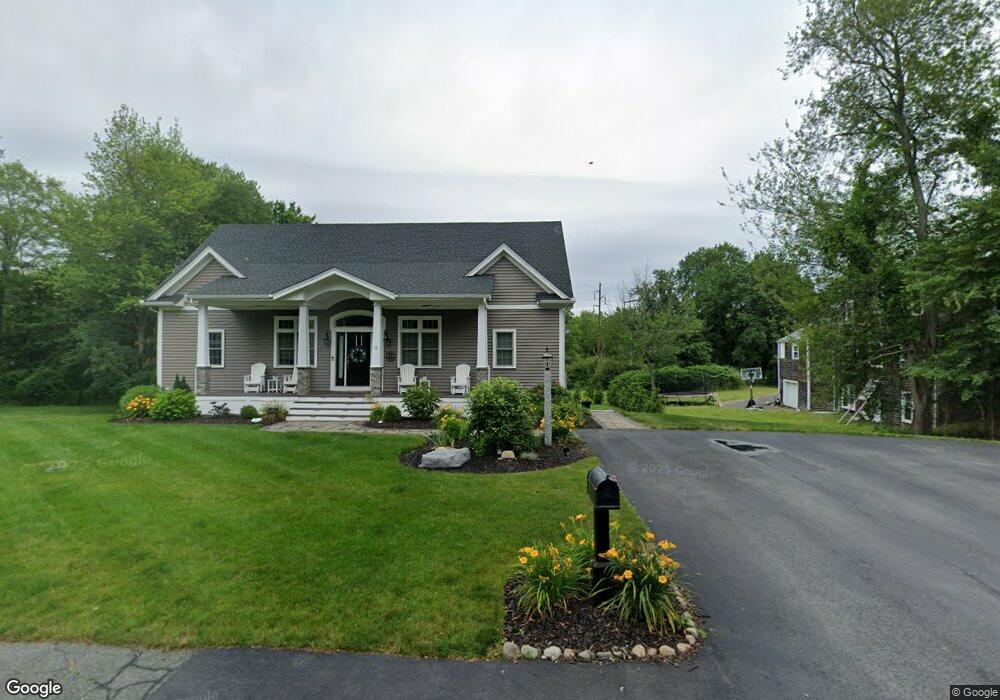
353 Walnut St Abington, MA 02351
Estimated Value: $668,000 - $703,000
3
Beds
3
Baths
1,956
Sq Ft
$349/Sq Ft
Est. Value
About This Home
This home is located at 353 Walnut St, Abington, MA 02351 and is currently estimated at $683,106, approximately $349 per square foot. 353 Walnut St is a home located in Plymouth County with nearby schools including Beaver Brook Elementary School, Abington Middle School, and Woodsdale School.
Ownership History
Date
Name
Owned For
Owner Type
Purchase Details
Closed on
Mar 15, 2021
Sold by
Nee Patrick J
Bought by
Nee Patrick J and Nee Shaunna C
Current Estimated Value
Purchase Details
Closed on
Nov 14, 2020
Sold by
Forbes Carine and Forbes Brittany
Bought by
Nee Patrick J
Home Financials for this Owner
Home Financials are based on the most recent Mortgage that was taken out on this home.
Original Mortgage
$500,000
Interest Rate
2.8%
Mortgage Type
VA
Purchase Details
Closed on
Oct 5, 2018
Sold by
Carrier Maureen M and Gover Catherine D
Bought by
Forbes Carine and Forbes Brittany
Home Financials for this Owner
Home Financials are based on the most recent Mortgage that was taken out on this home.
Original Mortgage
$389,193
Interest Rate
4.87%
Mortgage Type
FHA
Purchase Details
Closed on
Dec 1, 2017
Sold by
Mckenney Chales 3Rd Es
Bought by
Carrier Maureen M and Gover Catherine D
Home Financials for this Owner
Home Financials are based on the most recent Mortgage that was taken out on this home.
Original Mortgage
$290,000
Interest Rate
3.88%
Mortgage Type
New Conventional
Purchase Details
Closed on
Jun 17, 1985
Bought by
Mckenney Charles
Create a Home Valuation Report for This Property
The Home Valuation Report is an in-depth analysis detailing your home's value as well as a comparison with similar homes in the area
Home Values in the Area
Average Home Value in this Area
Purchase History
| Date | Buyer | Sale Price | Title Company |
|---|---|---|---|
| Nee Patrick J | -- | None Available | |
| Nee Patrick J | $500,000 | None Available | |
| Forbes Carine | $425,000 | -- | |
| Carrier Maureen M | $231,980 | -- | |
| Mckenney Charles | -- | -- |
Source: Public Records
Mortgage History
| Date | Status | Borrower | Loan Amount |
|---|---|---|---|
| Previous Owner | Nee Patrick J | $500,000 | |
| Previous Owner | Forbes Carine | $389,193 | |
| Previous Owner | Carrier Maureen M | $290,000 |
Source: Public Records
Tax History Compared to Growth
Tax History
| Year | Tax Paid | Tax Assessment Tax Assessment Total Assessment is a certain percentage of the fair market value that is determined by local assessors to be the total taxable value of land and additions on the property. | Land | Improvement |
|---|---|---|---|---|
| 2025 | $7,882 | $603,500 | $268,200 | $335,300 |
| 2024 | $7,631 | $570,300 | $244,300 | $326,000 |
| 2023 | $7,293 | $513,200 | $222,600 | $290,600 |
| 2022 | $7,117 | $467,600 | $186,300 | $281,300 |
| 2021 | $6,582 | $399,400 | $170,200 | $229,200 |
| 2020 | $6,715 | $395,000 | $171,400 | $223,600 |
| 2019 | $6,862 | $394,600 | $183,200 | $211,400 |
| 2018 | $6,091 | $341,800 | $176,000 | $165,800 |
| 2017 | $6,081 | $331,400 | $176,000 | $155,400 |
| 2016 | $5,564 | $310,300 | $161,800 | $148,500 |
| 2015 | $5,160 | $303,500 | $161,800 | $141,700 |
Source: Public Records
Map
Nearby Homes
- 87 Summer St
- 1098 Bedford St
- 40 Bedford St
- 63 Dewey Ave
- 37 Rockland St
- 10 Bank St
- 360 High St
- 300 High St
- 34 George h Gillespie Way
- 679 Plymouth St
- 41 Clapp St
- 66 Belmont St
- 164 Warren Ave
- 608 Plymouth St
- 257 Rockland St Unit 257
- 135-137 Temple St
- 333 Groveland St
- 63 Rice St
- 4 Locust Hill Ln
- 78 Linda St
- 5 Springwood Dr
- 323 Walnut St
- 360 Walnut St
- 2 Springwood Dr
- 370 Walnut St
- 373 Walnut St
- 89 Richard Rd
- 60 Richard Rd
- 16 Springwood Dr
- 16 Springwood Dr Unit 1
- 111 Richard Rd
- 386 Walnut St
- 88 Richard Rd
- 11 Springwood Dr
- 50 Bicknell Hill Rd
- 125 Richard Rd
- 400 Walnut St
- 108 Richard Rd
- 38 Bicknell Hill Rd
- 270 Bayberry Cir