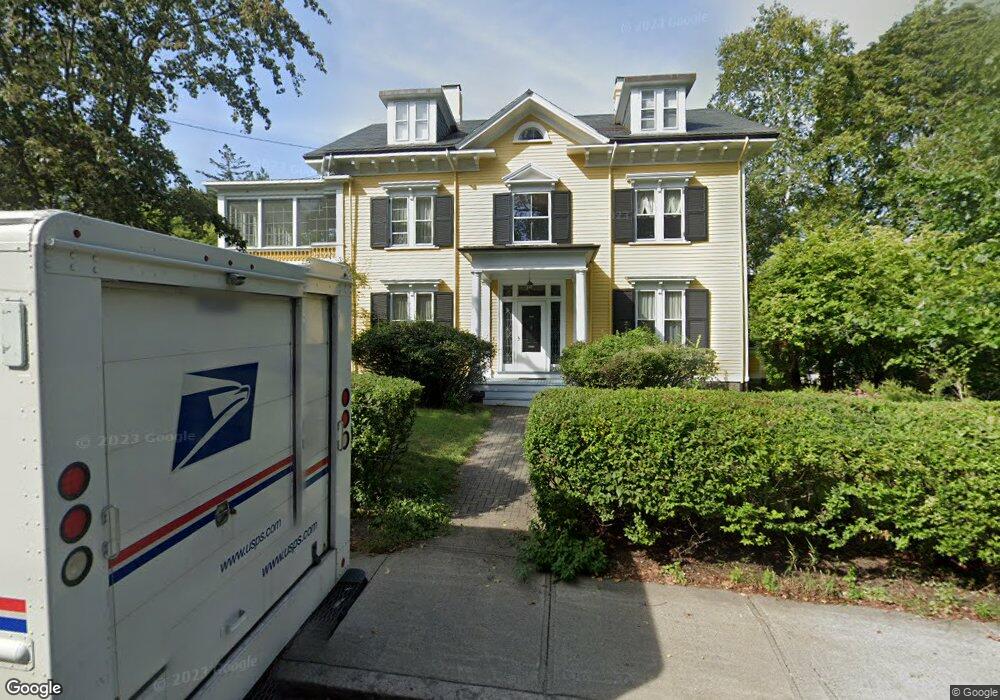
353 Walnut St Brookline, MA 02445
Brookline Village NeighborhoodEstimated Value: $4,380,000 - $5,603,000
8
Beds
4
Baths
5,779
Sq Ft
$853/Sq Ft
Est. Value
About This Home
This home is located at 353 Walnut St, Brookline, MA 02445 and is currently estimated at $4,928,168, approximately $852 per square foot. 353 Walnut St is a home located in Norfolk County with nearby schools including William H. Lincoln School, Brookline High School, and Maimonides School.
Ownership History
Date
Name
Owned For
Owner Type
Purchase Details
Closed on
May 10, 2007
Sold by
First Parish In Brookl
Bought by
Crossley Lisa J and Hegen Martin
Current Estimated Value
Home Financials for this Owner
Home Financials are based on the most recent Mortgage that was taken out on this home.
Original Mortgage
$960,000
Interest Rate
6.21%
Mortgage Type
Purchase Money Mortgage
Create a Home Valuation Report for This Property
The Home Valuation Report is an in-depth analysis detailing your home's value as well as a comparison with similar homes in the area
Home Values in the Area
Average Home Value in this Area
Purchase History
| Date | Buyer | Sale Price | Title Company |
|---|---|---|---|
| Crossley Lisa J | $1,200,000 | -- |
Source: Public Records
Mortgage History
| Date | Status | Borrower | Loan Amount |
|---|---|---|---|
| Open | Crossley Lisa J | $800,000 | |
| Closed | Crossley Lisa J | $904,000 | |
| Closed | Crossley Lisa J | $930,000 | |
| Closed | Crossley Lisa J | $960,000 |
Source: Public Records
Tax History
| Year | Tax Paid | Tax Assessment Tax Assessment Total Assessment is a certain percentage of the fair market value that is determined by local assessors to be the total taxable value of land and additions on the property. | Land | Improvement |
|---|---|---|---|---|
| 2025 | $41,707 | $4,225,600 | $1,578,300 | $2,647,300 |
| 2024 | $39,746 | $4,068,200 | $1,517,600 | $2,550,600 |
| 2023 | $36,989 | $3,710,000 | $1,264,800 | $2,445,200 |
| 2022 | $36,004 | $3,533,300 | $1,204,500 | $2,328,800 |
| 2021 | $33,295 | $3,397,400 | $1,158,200 | $2,239,200 |
| 2020 | $30,817 | $3,261,100 | $1,052,900 | $2,208,200 |
| 2019 | $29,101 | $3,105,800 | $1,002,800 | $2,103,000 |
| 2018 | $29,349 | $3,102,400 | $1,072,000 | $2,030,400 |
| 2017 | $28,917 | $2,926,800 | $1,011,300 | $1,915,500 |
| 2016 | $28,502 | $2,735,300 | $945,100 | $1,790,200 |
| 2015 | $27,302 | $2,556,400 | $883,300 | $1,673,100 |
| 2014 | $28,451 | $2,497,900 | $802,900 | $1,695,000 |
Source: Public Records
Map
Nearby Homes
- 18 Chestnut Place
- 42 Prince St
- 20 Rice St Unit 2
- 236 Walnut St
- 140 Sumner Rd Unit 1
- 124 Chestnut St Unit 2
- 24 Blake Rd
- 8 Leverett St Unit 3
- 21 Sargent Crossway
- 75 Greenough St Unit 2
- 71 Greenough St Unit 71-1
- 209 High St
- 241 Perkins St Unit D405
- 241 Perkins St Unit C407
- 241 Perkins St Unit C402
- 241 Perkins St Unit G102
- 222 Warren St
- 71 Highland Rd
- 3 Upland Rd Unit 2
- 55 Leicester St
Your Personal Tour Guide
Ask me questions while you tour the home.