Estimated Value: $71,000 - $110,000
2
Beds
1
Bath
732
Sq Ft
$124/Sq Ft
Est. Value
About This Home
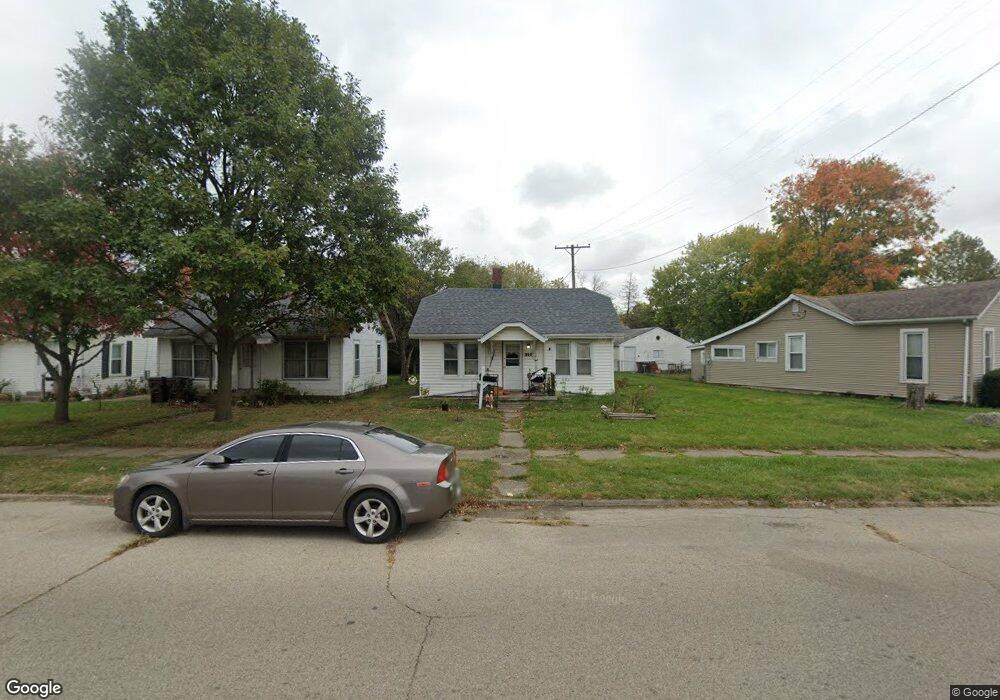
This home is located at 353 Walnut St, Xenia, OH 45385 and is currently estimated at $90,411, approximately $123 per square foot. 353 Walnut St is a home located in Greene County with nearby schools including Xenia High School, Summit Academy Community School for Alternative Learners - Xenia, and Legacy Christian Academy.
Ownership History
Date
Name
Owned For
Owner Type
Purchase Details
Closed on
Jul 29, 2019
Sold by
Hodes Leana S
Bought by
Hb Realty Llc
Current Estimated Value
Purchase Details
Closed on
Mar 2, 2018
Sold by
Applegate Ruth Anna
Bought by
Hodges Leana S
Purchase Details
Closed on
Mar 2, 2009
Sold by
Fannie Mae
Bought by
Applegate Beth and Hodges Leana S
Purchase Details
Closed on
Sep 4, 2008
Sold by
Brown Gertrude M
Bought by
Fanniemae and Federal National Mortgage Association
Purchase Details
Closed on
Oct 14, 2005
Sold by
Estate Of Gale E Stephens
Bought by
Brown Gertrude M
Home Financials for this Owner
Home Financials are based on the most recent Mortgage that was taken out on this home.
Original Mortgage
$50,400
Interest Rate
5.82%
Mortgage Type
Unknown
Create a Home Valuation Report for This Property
The Home Valuation Report is an in-depth analysis detailing your home's value as well as a comparison with similar homes in the area
Home Values in the Area
Average Home Value in this Area
Purchase History
| Date | Buyer | Sale Price | Title Company |
|---|---|---|---|
| Hb Realty Llc | $38,000 | None Available | |
| Hodges Leana S | -- | -- | |
| Applegate Beth | $25,200 | Accutitle Agency Inc | |
| Fanniemae | $26,000 | None Available | |
| Brown Gertrude M | $53,100 | -- |
Source: Public Records
Mortgage History
| Date | Status | Borrower | Loan Amount |
|---|---|---|---|
| Previous Owner | Brown Gertrude M | $50,400 |
Source: Public Records
Tax History Compared to Growth
Tax History
| Year | Tax Paid | Tax Assessment Tax Assessment Total Assessment is a certain percentage of the fair market value that is determined by local assessors to be the total taxable value of land and additions on the property. | Land | Improvement |
|---|---|---|---|---|
| 2024 | $894 | $20,890 | $4,860 | $16,030 |
| 2023 | $894 | $20,890 | $4,860 | $16,030 |
| 2022 | $791 | $15,760 | $3,890 | $11,870 |
| 2021 | $801 | $15,760 | $3,890 | $11,870 |
| 2020 | $768 | $15,760 | $3,890 | $11,870 |
| 2019 | $681 | $13,170 | $4,200 | $8,970 |
| 2018 | $684 | $13,170 | $4,200 | $8,970 |
| 2017 | $664 | $13,170 | $4,200 | $8,970 |
| 2016 | $661 | $12,490 | $4,200 | $8,290 |
| 2015 | $663 | $12,490 | $4,200 | $8,290 |
| 2014 | $635 | $12,490 | $4,200 | $8,290 |
Source: Public Records
Map
Nearby Homes