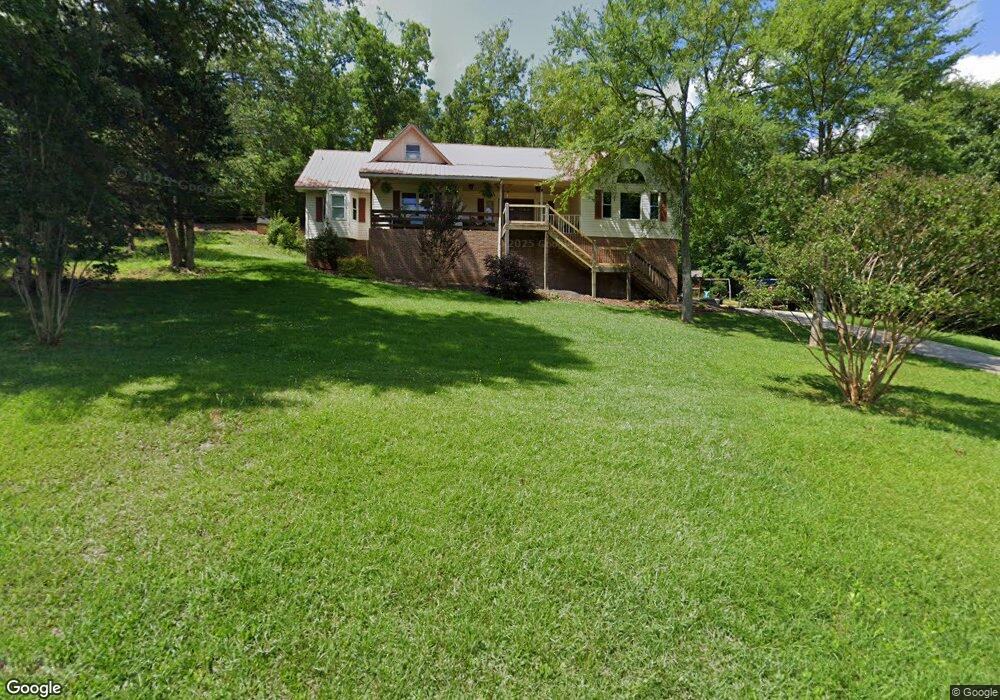
353 Whispering Pines Dr Trenton, GA 30752
Estimated Value: $262,000 - $440,000
3
Beds
3
Baths
2,302
Sq Ft
$165/Sq Ft
Est. Value
About This Home
This home is located at 353 Whispering Pines Dr, Trenton, GA 30752 and is currently estimated at $378,979, approximately $164 per square foot. 353 Whispering Pines Dr is a home located in Dade County with nearby schools including Dade Middle School and Dade County High School.
Ownership History
Date
Name
Owned For
Owner Type
Purchase Details
Closed on
May 22, 2015
Sold by
Mig Llc
Bought by
Clark James W and Clark Amanda D
Current Estimated Value
Home Financials for this Owner
Home Financials are based on the most recent Mortgage that was taken out on this home.
Original Mortgage
$76,697
Outstanding Balance
$59,277
Interest Rate
3.77%
Mortgage Type
New Conventional
Estimated Equity
$319,702
Purchase Details
Closed on
Nov 14, 2014
Sold by
Flagstar Bank Fsb
Bought by
Secretary Of Housing & Urban Development
Purchase Details
Closed on
Apr 15, 2014
Sold by
Lidstone Vincent I
Bought by
Flagstar Bank Fsb
Purchase Details
Closed on
Jan 7, 2014
Sold by
Flagstar Bank Fsb
Bought by
Sec Of Housing & Urban
Purchase Details
Closed on
Jan 11, 2012
Sold by
Lidstone Vincent I
Bought by
Lidstone Vincent I
Purchase Details
Closed on
Sep 8, 2011
Sold by
Lidstone Vincent I
Bought by
Lidstone Vincent I
Purchase Details
Closed on
Jul 21, 1995
Sold by
Giles Edward and Giles Diane
Bought by
Lidstone Vincent I
Purchase Details
Closed on
Jan 3, 1994
Sold by
Diane Edward H and Diane Gil
Purchase Details
Closed on
Dec 17, 1993
Sold by
James Helms
Create a Home Valuation Report for This Property
The Home Valuation Report is an in-depth analysis detailing your home's value as well as a comparison with similar homes in the area
Home Values in the Area
Average Home Value in this Area
Purchase History
| Date | Buyer | Sale Price | Title Company |
|---|---|---|---|
| Clark James W | $100,000 | -- | |
| Mig Llc | -- | -- | |
| Secretary Of Housing & Urban Development | $150,300 | -- | |
| Flagstar Bank Fsb | -- | -- | |
| Sec Of Housing & Urban | $150,250 | -- | |
| Flagstar Bank Fsb | $185,727 | -- | |
| Lidstone Vincent I | $129,900 | -- | |
| Lidstone Vincent I | $169,000 | -- | |
| Lidstone Vincent I | $117,000 | -- | |
| -- | -- | -- | |
| -- | $10,900 | -- |
Source: Public Records
Mortgage History
| Date | Status | Borrower | Loan Amount |
|---|---|---|---|
| Open | Mig Llc | $76,697 | |
| Closed | Mig Llc | $105,000 |
Source: Public Records
Tax History Compared to Growth
Tax History
| Year | Tax Paid | Tax Assessment Tax Assessment Total Assessment is a certain percentage of the fair market value that is determined by local assessors to be the total taxable value of land and additions on the property. | Land | Improvement |
|---|---|---|---|---|
| 2024 | $1,182 | $126,400 | $20,280 | $106,120 |
| 2023 | $2,765 | $123,520 | $20,280 | $103,240 |
| 2022 | $1,193 | $101,560 | $20,280 | $81,280 |
| 2021 | $1,194 | $83,640 | $9,760 | $73,880 |
| 2020 | $1,243 | $79,240 | $7,960 | $71,280 |
| 2019 | $1,255 | $81,000 | $7,960 | $73,040 |
| 2018 | $1,943 | $81,000 | $7,960 | $73,040 |
| 2017 | $1,278 | $67,080 | $7,960 | $59,120 |
| 2016 | $1,273 | $66,560 | $7,960 | $58,600 |
| 2015 | $1,291 | $55,280 | $7,960 | $47,320 |
| 2014 | -- | $53,120 | $9,560 | $43,560 |
| 2013 | -- | $74,800 | $14,720 | $60,080 |
Source: Public Records
Map
Nearby Homes
- 54 Whispering Pines Dr
- 0 Northwoods Ln Unit 1521613
- 165 N Woods Ln
- 553 Back Valley Rd
- 11080 U S 11
- 1150 Back Valley Rd
- 000 W Ga 136 Hwy
- 134 Melissa Dr
- 204 Melissa Dr
- 493 Bernice Dr
- 738 Sells Ln
- 0 Georgia 136
- 535 Castle Dr
- 272 Cloud Rd
- 403 Lyman Daniel Rd
- 102 Sunset Dr
- 292 District Line Rd
- 1145 Daniels Rd
- 329 Glenview Dr
- 331 Glenview Dr
- 421 Whispering Pines Dr
- 0 Whispering Pine
- 235 Whispering Pine
- 235 Whispering Pines Dr
- 18 Lake Dr
- 260 Tanglewood Trail
- 0 Lake Dr
- 0 Lake Dr Unit 1029389
- 0 Lake Dr Unit 1286156
- 0 Lake Dr Unit 1213906
- 0 Lake Dr Unit RTC2727683
- 0 Lake Dr Unit 1179606
- 0 Lake Dr Unit 1296723
- 296 Whispering Pines Dr
- 467 Whispering Pines Dr
- 501 Whispering Pines Dr
- 46 Ivey Ln
- 107 Lake Dr
- 120 Tanglewood Trail
- 120 Tanglewood Tr