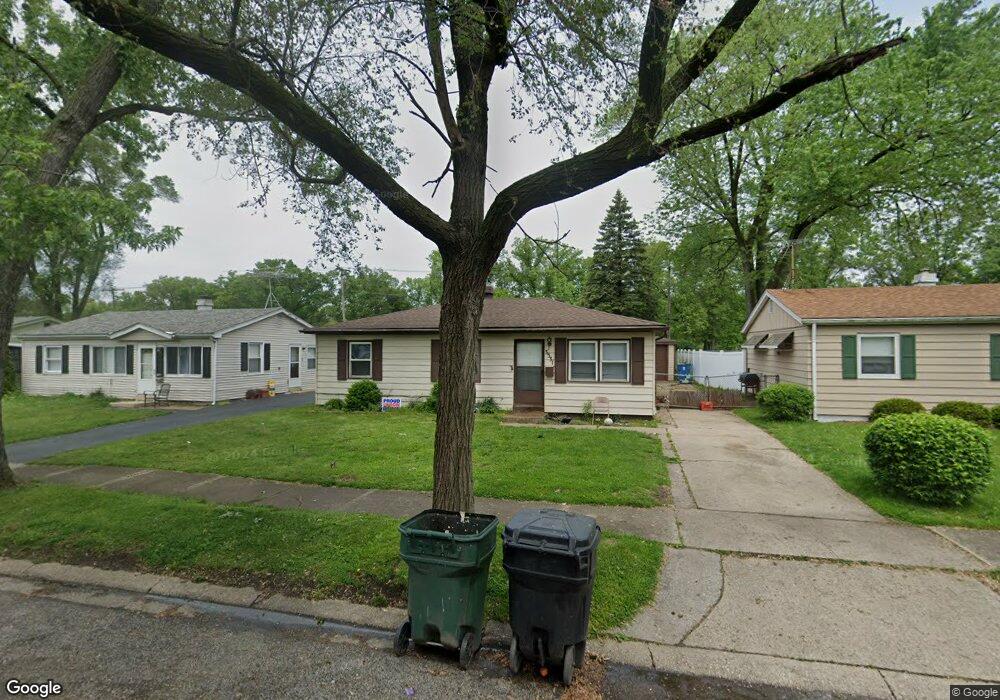
3531 163rd St Hammond, IN 46323
Hessville NeighborhoodEstimated Value: $157,000 - $226,000
3
Beds
1
Bath
925
Sq Ft
$203/Sq Ft
Est. Value
About This Home
This home is located at 3531 163rd St, Hammond, IN 46323 and is currently estimated at $187,819, approximately $203 per square foot. 3531 163rd St is a home located in Lake County with nearby schools including Warren G Harding Elementary School, Charles N Scott Middle School, and Morton Senior High School.
Ownership History
Date
Name
Owned For
Owner Type
Purchase Details
Closed on
Aug 31, 2017
Sold by
Sebago Properties Llc
Bought by
Ez Property Solutions Llc
Current Estimated Value
Purchase Details
Closed on
May 18, 2017
Sold by
Rafiq Mohammad and Nusheen Shahzadi
Bought by
She And R Llc
Purchase Details
Closed on
Dec 9, 2016
Sold by
Avila Gina Hilaria
Bought by
Rafiq Mohammad and Nusheen Shahzadi
Purchase Details
Closed on
Jul 29, 2016
Sold by
Avila Saul and Avila Rodolfo
Bought by
Avila Gina Hilaria
Purchase Details
Closed on
Dec 12, 2014
Sold by
Jimenez Gina H and Avila Gina Hilaria
Bought by
Avila Gina Hilaria and Avila Saul
Purchase Details
Closed on
Feb 15, 2008
Sold by
Avila Saul and Jimenez Gina H
Bought by
Jimenez Gina H
Home Financials for this Owner
Home Financials are based on the most recent Mortgage that was taken out on this home.
Original Mortgage
$93,000
Interest Rate
5.75%
Mortgage Type
New Conventional
Create a Home Valuation Report for This Property
The Home Valuation Report is an in-depth analysis detailing your home's value as well as a comparison with similar homes in the area
Home Values in the Area
Average Home Value in this Area
Purchase History
| Date | Buyer | Sale Price | Title Company |
|---|---|---|---|
| Ez Property Solutions Llc | -- | Indiana Title Network Co | |
| She And R Llc | -- | None Available | |
| Rafiq Mohammad | -- | Fidelity National Title Co | |
| Avila Gina Hilaria | -- | None Available | |
| Avila Gina Hilaria | -- | None Available | |
| Jimenez Gina H | -- | Meridian Title Corp |
Source: Public Records
Mortgage History
| Date | Status | Borrower | Loan Amount |
|---|---|---|---|
| Previous Owner | Jimenez Gina H | $93,000 |
Source: Public Records
Tax History Compared to Growth
Tax History
| Year | Tax Paid | Tax Assessment Tax Assessment Total Assessment is a certain percentage of the fair market value that is determined by local assessors to be the total taxable value of land and additions on the property. | Land | Improvement |
|---|---|---|---|---|
| 2024 | $5,363 | $121,700 | $29,200 | $92,500 |
| 2023 | $2,849 | $112,200 | $29,200 | $83,000 |
| 2022 | $2,849 | $106,300 | $29,200 | $77,100 |
| 2021 | $2,385 | $88,000 | $17,200 | $70,800 |
| 2020 | $2,290 | $83,900 | $17,200 | $66,700 |
| 2019 | $2,308 | $80,100 | $17,200 | $62,900 |
| 2018 | $2,333 | $74,200 | $17,200 | $57,000 |
| 2017 | $2,622 | $72,800 | $17,200 | $55,600 |
| 2016 | $199 | $71,600 | $17,200 | $54,400 |
| 2014 | $245 | $69,800 | $17,200 | $52,600 |
| 2013 | $643 | $70,400 | $17,200 | $53,200 |
Source: Public Records
Map
Nearby Homes
- 3532 164th St
- 3448 164th St
- 6435 Nebraska Ave
- 6311 New Jersey Ave
- 6612 Missouri Ave
- 3220 165th St
- 6703 Nebraska Ave
- 3140 Crane Place
- 6705 Nebraska Ave
- 6538 Rhode Island Ave
- 6635 Illinois Ave
- 6732 Montana Ave
- 6642 Illinois Ave
- 6525 Carolina Ave
- 6746 Rhode Island Ave
- 6849 Maryland Ave
- 6822 Ohio Ave
- 3534 170th Place
- 2728 162nd St
- 2726 162nd Place