
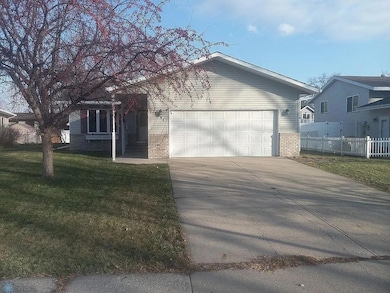
3531 1st St N Fargo, ND 58102
Trollwood NeighborhoodEstimated payment $2,301/month
Highlights
- 2 Fireplaces
- No HOA
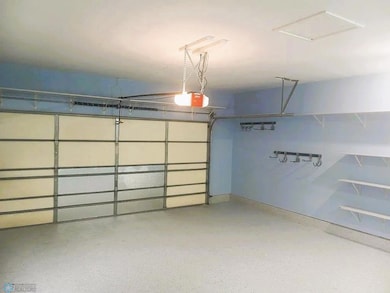
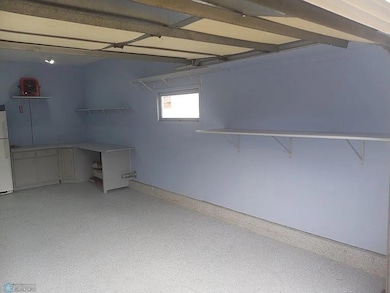
- 2 Car Attached Garage
- Longfellow Elementary School Rated A
- The kitchen features windows
- Living Room
About This Home
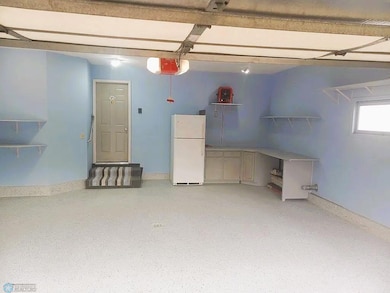
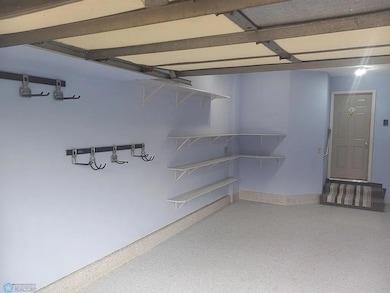
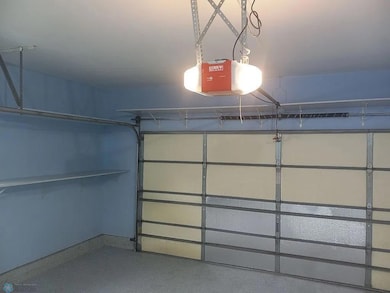
Beautiful Rambler House for sale. Built in 1989. 5 bedroom/3bath with main floor and lower level laundry rooms, Heated and insulted 2 stall oversized garage. Plumbing for laundry upstairs and downstairs. Fenced back yard with apple fruit tree, raspberry patch, rhubarb plants. Located next to Trollwood Park in N.Fargo and close to Edgewood Golf club. Very quiet neighborhood. Specs for the house: approx 2658 sqft of living space. 1329 per level. Main level: 3 bedrooms, 2 bath. Living Room with electric fireplace built in to a custom 8 shelf Dickens Village display cabinet. Wired for plugging in the lighted display houses and shops. Extra large kitchen, dining room, 20'x13'. There is a food pantry with 8 shelves and a door. Also an appliance storage pantry off of the kitchen. The primary bedroom has a 3/4 bathroom with walk in shower, and 2 clothes closets. #3 bedroom is plumbed for an extra laundry upstairs and could be a flex/bonus room. All bathrooms have tall toilet stools. The kitchen comes with a refrigerator freezer, glass top stove oven, new dishwasher, new stainless steel sink and new garbage disposal, new microwave over the stove. The patio door off the kitchen goes to a composition deck, 14'x10'. Take 2 steps down to a 15'x13' brick pavers bbq patio at ground level. Going downstairs you enter the family room with a wood burning brick fireplace. it is 22'x13' room with a bar cabinet area on the far end with shelves above. Next to the family room is the 2nd full bathroom. Bedroom #4 is 11'x16' with closet. Bedroom #5 is 11'x12' with closet. Bedroom #6 is 12'x19'. It was used for a dance studio with wood planking flooring. All rooms downstairs have egress windows. The utility room has a Lenox natural gas furnace and AC unit. The water heater is an 80 gallon electric. The washer and dryer and laundry sink are on the south wall with shelving above. The house is wired for cable TV and has Cable One or Sparklight internet service into the utility room for router set up. Quiet neighborhood. Walking distance to Trollwood Park, disc golf, basketball courts, kids play ground, Reservable graduation party or wedding party covered eating building with tables and chairs with lights and electricity. Paved Walking paths. Owner related to agent.
Home Details
Home Type
- Single Family
Est. Annual Taxes
- $1,126
Year Built
- Built in 1988
Lot Details
- 8,364 Sq Ft Lot
- Lot Dimensions are 46x130
- Privacy Fence
- Chain Link Fence
- Few Trees
Parking
- 2 Car Attached Garage
Home Design
- Architectural Shingle Roof
- Steel Siding
Interior Spaces
- 1-Story Property
- 2 Fireplaces
- Wood Burning Fireplace
- Electric Fireplace
- Family Room
- Living Room
- Combination Kitchen and Dining Room
- Utility Room
- Basement
- Basement Window Egress
Kitchen
- Range
- Microwave
- Dishwasher
- Disposal
- The kitchen features windows
Bedrooms and Bathrooms
- 5 Bedrooms
Laundry
- Laundry Room
- Dryer
- Washer
Utilities
- Forced Air Heating and Cooling System
- Electric Water Heater
Community Details
- No Home Owners Association
- Vanradens 4Th Subdivision
Listing and Financial Details
- Assessor Parcel Number 01359000140000
Map
Home Values in the Area
Average Home Value in this Area
Tax History
| Year | Tax Paid | Tax Assessment Tax Assessment Total Assessment is a certain percentage of the fair market value that is determined by local assessors to be the total taxable value of land and additions on the property. | Land | Improvement |
|---|---|---|---|---|
| 2024 | $1,126 | $156,450 | $25,650 | $130,800 |
| 2023 | $1,525 | $151,900 | $25,650 | $126,250 |
| 2022 | $3,864 | $138,100 | $25,650 | $112,450 |
| 2021 | $1,793 | $125,550 | $25,650 | $99,900 |
| 2020 | $1,942 | $119,550 | $25,650 | $93,900 |
| 2019 | $1,615 | $119,550 | $14,250 | $105,300 |
| 2018 | $1,483 | $115,250 | $14,250 | $101,000 |
| 2017 | $1,275 | $107,700 | $14,250 | $93,450 |
| 2016 | $947 | $97,900 | $14,250 | $83,650 |
| 2015 | $2,573 | $97,900 | $10,700 | $87,200 |
| 2014 | $1,360 | $98,550 | $10,700 | $87,850 |
| 2013 | $2,460 | $93,850 | $10,700 | $83,150 |
Property History
| Date | Event | Price | List to Sale | Price per Sq Ft |
|---|---|---|---|---|
| 11/06/2025 11/06/25 | Price Changed | $419,000 | -0.9% | $158 / Sq Ft |
| 10/26/2025 10/26/25 | Price Changed | $423,000 | -0.7% | $159 / Sq Ft |
| 10/08/2025 10/08/25 | Price Changed | $426,000 | -0.7% | $160 / Sq Ft |
| 09/29/2025 09/29/25 | For Sale | $429,000 | -- | $161 / Sq Ft |
Purchase History
| Date | Type | Sale Price | Title Company |
|---|---|---|---|
| Warranty Deed | $630,000 | The Title Co Residential | |
| Interfamily Deed Transfer | -- | None Available | |
| Warranty Deed | $159,902 | The Title Co Residential | |
| Warranty Deed | $159,902 | -- |
Mortgage History
| Date | Status | Loan Amount | Loan Type |
|---|---|---|---|
| Open | $80,000 | Purchase Money Mortgage | |
| Previous Owner | $80,000 | New Conventional |
Source: NorthstarMLS
MLS Number: 6795889
APN: 01-3590-00140-000
Disclaimer: Certain information contained herein is derived from information provided by parties other than Homes.com. All information provided is deemed reliable, but is not guaranteed to be accurate and should be independently verified.
![]() Based on information submitted to the MLS GRID. All data is obtained from various sources and may not have been verified by broker or MLS GRID. Supplied Open House Information is subject to change without notice. All information should be independently reviewed and verified for accuracy. Properties may or may not be listed by the office/agent presenting the information. Some IDX listings have been excluded from this website.
Based on information submitted to the MLS GRID. All data is obtained from various sources and may not have been verified by broker or MLS GRID. Supplied Open House Information is subject to change without notice. All information should be independently reviewed and verified for accuracy. Properties may or may not be listed by the office/agent presenting the information. Some IDX listings have been excluded from this website.
The Digital Millennium Copyright Act of 1998, 17 U.S.C. § 512 (the “DMCA”) provides recourse for copyright owners who believe that material appearing on the Internet infringes their rights under U.S. copyright law. If you believe in good faith that any content or material made available in connection with our website or services infringes your copyright, you (or your agent) may send us a notice requesting that the content or material be removed, or access to it blocked.
Notices must be sent in writing by email to DMCAnotice@MLSGrid.com.
The DMCA requires that your notice of alleged copyright infringement include the following information:
(1) description of the copyrighted work that is the subject of claimed infringement;
(2) description of the alleged infringing content and information sufficient to permit us to locate the content;
(3) contact information for you, including your address, telephone number and email address;
(4) a statement by you that you have a good faith belief that the content in the manner complained of is not authorized by the copyright owner, or its agent, or by the operation of any law;
(5) a statement by you, signed under penalty of perjury, that the information in the notification is accurate and that you have the authority to enforce the copyrights that are claimed to be infringed; and
(6) a physical or electronic signature of the copyright owner or a person authorized to act on the copyright owner’s behalf. Failure to include all of the above information may result in the delay of the processing of your complaint.
- 21 35th Ave NE
- 3217 Cherry Ln N
- 108 32nd Ave N
- 3667 Evergreen Rd N
- 3513 Par St N
- 2937 Edgewood Dr N
- 2925 Edgewood Dr N
- 2926 Edgewood Dr N
- 2939 Maple St N
- 801 32nd Ave N Unit A102
- 3129 8th St N
- 3113 8th St N
- 2902 3rd St N
- 501 Forest Ave N Unit C
- 87 28th Ave N
- 2807 Edgewood Dr N
- 1031 Gibraltor Ave
- 101 27th Ave N
- 909 40th Ave N
- 310 27th Ave N
- 201 35th Ave N
- 3301-3315 N Broadway Dr
- 3202 Broadway N
- 3105 Broadway N
- 517 28th Ave N
- 1151 32nd Ave N
- 1919 University Dr N
- 1601 University Dr N
- 1342 Broadway N
- 1310 Broadway N
- 1302 9th St N
- 1213 9th St N
- 1146 9th St N
- 714 11th Ave N
- 814 11th Ave N
- 1224 11th Ave N
- 1224 11th Ave N
- 820 10th Ave N
- 620 9th Ave
- 1132 16th St N
