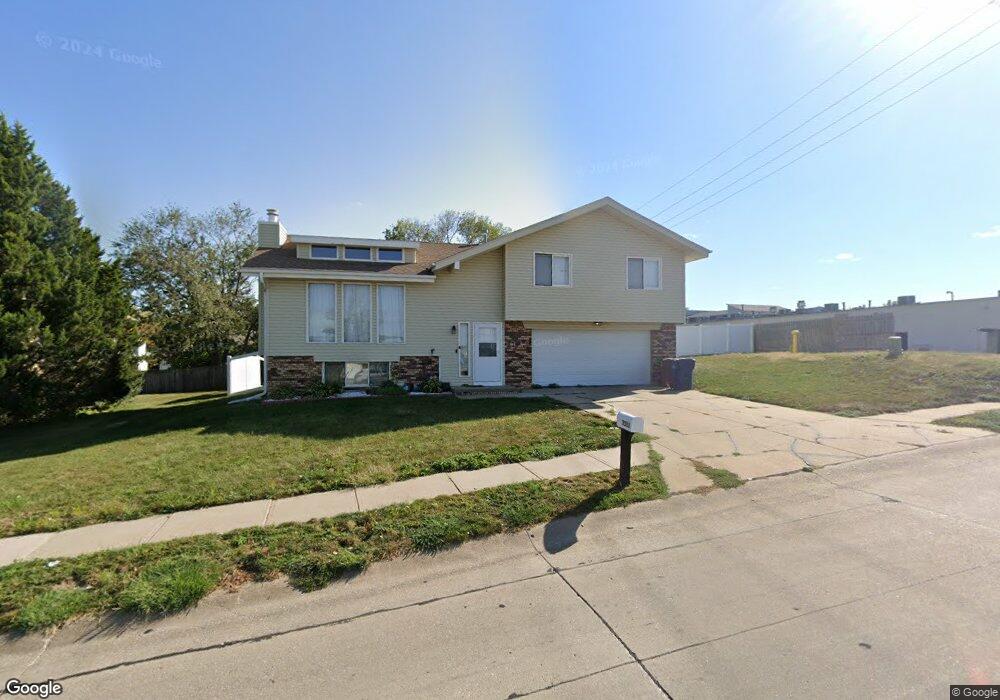
3531 Comstock Ave Bellevue, NE 68123
Estimated Value: $220,000 - $254,748
3
Beds
2
Baths
1,648
Sq Ft
$144/Sq Ft
Est. Value
About This Home
This home is located at 3531 Comstock Ave, Bellevue, NE 68123 and is currently estimated at $237,437, approximately $144 per square foot. 3531 Comstock Ave is a home located in Sarpy County with nearby schools including Golden Hills Elementary School, Papillion Middle School, and Papillion La Vista South High School.
Ownership History
Date
Name
Owned For
Owner Type
Purchase Details
Closed on
May 25, 2022
Sold by
Little Venez Llc
Bought by
Ouedraogo Wendnonga J and Kanyala Rolande
Current Estimated Value
Home Financials for this Owner
Home Financials are based on the most recent Mortgage that was taken out on this home.
Original Mortgage
$218,960
Outstanding Balance
$207,408
Interest Rate
5.25%
Mortgage Type
FHA
Estimated Equity
$30,029
Purchase Details
Closed on
Dec 9, 2021
Sold by
Go Development Llc
Bought by
Little Venez Llc
Home Financials for this Owner
Home Financials are based on the most recent Mortgage that was taken out on this home.
Original Mortgage
$180,000
Interest Rate
3.14%
Mortgage Type
Commercial
Purchase Details
Closed on
Sep 22, 2021
Sold by
Smith Esper and Smith Betrail Marie
Bought by
Go Development Llc
Create a Home Valuation Report for This Property
The Home Valuation Report is an in-depth analysis detailing your home's value as well as a comparison with similar homes in the area
Home Values in the Area
Average Home Value in this Area
Purchase History
| Date | Buyer | Sale Price | Title Company |
|---|---|---|---|
| Ouedraogo Wendnonga J | $223,000 | None Listed On Document | |
| Little Venez Llc | $149,000 | New Title Company Name | |
| Go Development Llc | $150,000 | Dri Title & Escrow |
Source: Public Records
Mortgage History
| Date | Status | Borrower | Loan Amount |
|---|---|---|---|
| Open | Ouedraogo Wendnonga J | $218,960 | |
| Previous Owner | Little Venez Llc | $180,000 |
Source: Public Records
Tax History
| Year | Tax Paid | Tax Assessment Tax Assessment Total Assessment is a certain percentage of the fair market value that is determined by local assessors to be the total taxable value of land and additions on the property. | Land | Improvement |
|---|---|---|---|---|
| 2025 | $3,442 | $216,158 | $39,000 | $177,158 |
| 2024 | $4,099 | $200,414 | $34,000 | $166,414 |
| 2023 | $4,099 | $195,998 | $34,000 | $161,998 |
| 2022 | $3,887 | $175,334 | $32,000 | $143,334 |
| 2021 | $3,626 | $161,234 | $26,000 | $135,234 |
| 2020 | $3,353 | $148,278 | $26,000 | $122,278 |
| 2019 | $3,107 | $137,510 | $22,000 | $115,510 |
| 2018 | $3,104 | $135,438 | $22,000 | $113,438 |
| 2017 | $3,052 | $133,197 | $22,000 | $111,197 |
| 2016 | $3,023 | $132,111 | $22,000 | $110,111 |
| 2015 | $2,916 | $127,791 | $22,000 | $105,791 |
| 2014 | $2,878 | $125,303 | $22,000 | $103,303 |
| 2012 | -- | $124,591 | $22,000 | $102,591 |
Source: Public Records
Map
Nearby Homes
- 3422 Nugget Cir
- 11723 S 39th St
- 11663 Trumble Loup E
- 11406 S 43rd St
- 11314 S 44th St
- 11307 S 45th St
- 12015 S 44th St
- 12019 S 44th St
- 10700 Old 36th St Unit 10706
- 12013 Daniell Rd
- 10131 S 25th St
- 12110 Quail Dr
- 12103 S 44th St
- 12033 Daniell Rd
- 4302 Chennault St
- 12037 Daniell Rd
- 4802 Lakeside Cir
- 11318 S 47th St
- 12105 Daniell Rd
- 12039 S 45th Ave
- 3527 Comstock Ave
- 3526 W Dutchman Cir
- 3525 Comstock Ave
- 3525 Comstock
- 3522 W Dutchman Cir
- 3530 W Dutchman Cir
- 3523 Comstock Ave
- 3521 Comstock Ave
- 3518 W Dutchman Cir
- 3519 Comstock Ave
- 3519 S Comstock
- 3519 Comstock Ave
- 3525 W Dutchman Cir
- 3524 Comstock Ave
- 3517 Comstock Ave
- 3522 Comstock Ave
- 3520 Comstock Ave
- 3520 Comstock
- 3514 W Dutchman Cir
- 3521 W Dutchman Cir
Your Personal Tour Guide
Ask me questions while you tour the home.