Estimated Value: $223,000 - $265,000
2
Beds
1
Bath
1,513
Sq Ft
$165/Sq Ft
Est. Value
About This Home
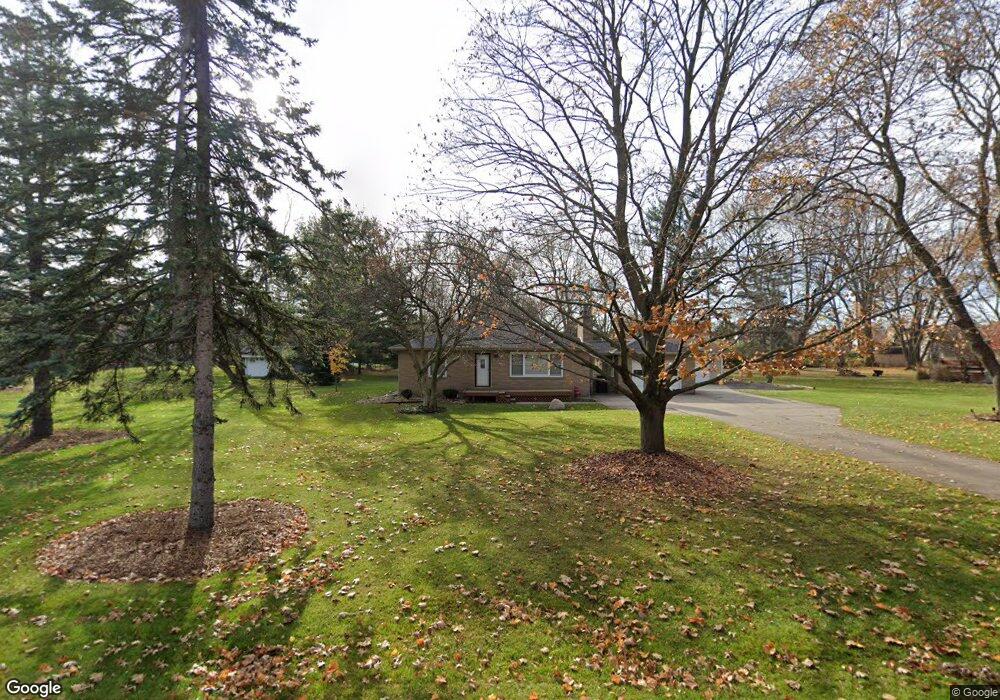
This home is located at 3531 Dell Rd, Holt, MI 48842 and is currently estimated at $249,766, approximately $165 per square foot. 3531 Dell Rd is a home located in Ingham County with nearby schools including Elliott Elementary School, Hope Middle School, and Holt Junior High School.
Ownership History
Date
Name
Owned For
Owner Type
Purchase Details
Closed on
Oct 7, 2016
Sold by
Drolett Corey and Drolett Megan
Bought by
Drolett John M
Current Estimated Value
Home Financials for this Owner
Home Financials are based on the most recent Mortgage that was taken out on this home.
Original Mortgage
$136,800
Outstanding Balance
$109,671
Interest Rate
3.46%
Mortgage Type
New Conventional
Estimated Equity
$140,095
Purchase Details
Closed on
Mar 5, 2009
Sold by
Sich Larry J
Bought by
Drolett Corey
Home Financials for this Owner
Home Financials are based on the most recent Mortgage that was taken out on this home.
Original Mortgage
$116,844
Interest Rate
5.2%
Mortgage Type
FHA
Purchase Details
Closed on
Jun 1, 2006
Sold by
Ball Dawn M
Bought by
Sich Larry J
Purchase Details
Closed on
Aug 22, 1997
Create a Home Valuation Report for This Property
The Home Valuation Report is an in-depth analysis detailing your home's value as well as a comparison with similar homes in the area
Home Values in the Area
Average Home Value in this Area
Purchase History
| Date | Buyer | Sale Price | Title Company |
|---|---|---|---|
| Drolett John M | $144,000 | None Available | |
| Drolett Corey | $119,000 | Tri County Title Agency Llc | |
| Sich Larry J | $147,000 | None Available | |
| -- | $92,000 | -- |
Source: Public Records
Mortgage History
| Date | Status | Borrower | Loan Amount |
|---|---|---|---|
| Open | Drolett John M | $136,800 | |
| Previous Owner | Drolett Corey | $116,844 |
Source: Public Records
Tax History
| Year | Tax Paid | Tax Assessment Tax Assessment Total Assessment is a certain percentage of the fair market value that is determined by local assessors to be the total taxable value of land and additions on the property. | Land | Improvement |
|---|---|---|---|---|
| 2025 | $4,091 | $123,300 | $50,000 | $73,300 |
| 2024 | $10 | $110,000 | $40,600 | $69,400 |
| 2023 | $3,795 | $98,300 | $35,000 | $63,300 |
| 2022 | $3,617 | $86,200 | $28,500 | $57,700 |
| 2021 | $3,535 | $83,000 | $18,800 | $64,200 |
| 2020 | $3,611 | $79,000 | $18,800 | $60,200 |
| 2019 | $3,443 | $75,300 | $18,800 | $56,500 |
| 2018 | $3,422 | $72,200 | $18,800 | $53,400 |
| 2017 | $3,150 | $72,200 | $18,800 | $53,400 |
| 2016 | $3,121 | $69,500 | $22,500 | $47,000 |
| 2015 | $3,057 | $66,400 | $44,900 | $21,500 |
| 2014 | $3,057 | $65,100 | $42,500 | $22,600 |
Source: Public Records
Map
Nearby Homes
- 3680 Bayou Place
- 0 Dell Rd Unit 290382
- 2792 Dellridge Dr
- 3215 Sandhill Rd
- 3930 Camperdown Dr
- 3990 Camperdown Dr
- 4029 N Pine Dell Dr
- 3860 Knotwood Dr
- 4094 Sebring Dr
- 2650 Navigator Ln
- 2611 Navigator
- 4106 Sebring Dr
- 4118 Sebring Dr
- 2655 Navigator Ln
- 2645 Navigator Ln
- 2635 Navigator Ln
- 2617 Navigator Ln
- 2612 Navigator Ln
- 2668 Maritime Dr
- 2545 Hummingbird Ln
Your Personal Tour Guide
Ask me questions while you tour the home.