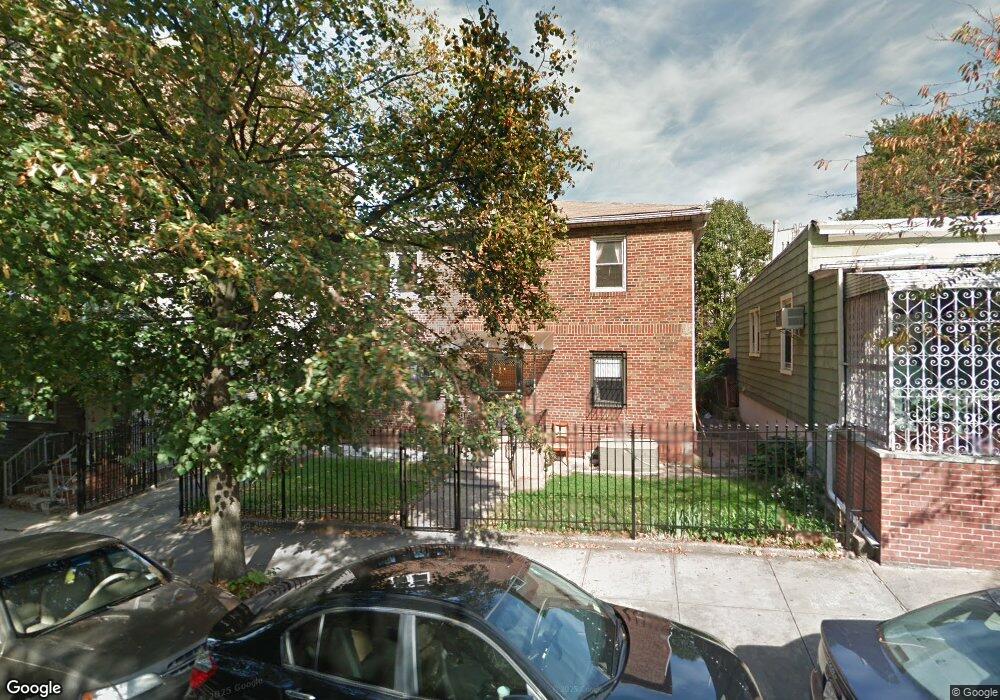
3531 Leverich St Jackson Heights, NY 11372
Jackson Heights NeighborhoodEstimated Value: $1,217,000 - $1,321,000
--
Bed
--
Bath
1,836
Sq Ft
$690/Sq Ft
Est. Value
About This Home
This home is located at 3531 Leverich St, Jackson Heights, NY 11372 and is currently estimated at $1,267,514, approximately $690 per square foot. 3531 Leverich St is a home located in Queens County with nearby schools including P.S. 69 Jackson Heights, I.S. 230, and William Cullen Bryant High School.
Ownership History
Date
Name
Owned For
Owner Type
Purchase Details
Closed on
Apr 9, 2019
Sold by
Hossain Mohammed K and Sayed Abu
Bought by
Sayed Abu
Current Estimated Value
Purchase Details
Closed on
Jul 17, 2013
Sold by
Hossain Mohammed K and Motin Abdul
Bought by
Hossain Mohammed K and Sayed Abu
Purchase Details
Closed on
Dec 18, 2011
Sold by
Hossain Mohammed K
Bought by
Hossain Mohammed K and Motin Abdul
Purchase Details
Closed on
Jul 18, 1997
Sold by
Hsu Ming Chiang and Hsu Shu An
Bought by
Hossain Mohammed K
Home Financials for this Owner
Home Financials are based on the most recent Mortgage that was taken out on this home.
Original Mortgage
$270,000
Interest Rate
7.31%
Purchase Details
Closed on
Nov 16, 1995
Sold by
Hsu Ming Chiang and Hsu Shu An
Bought by
Hsu Ming Chiang and Hsu Shu Ann
Create a Home Valuation Report for This Property
The Home Valuation Report is an in-depth analysis detailing your home's value as well as a comparison with similar homes in the area
Home Values in the Area
Average Home Value in this Area
Purchase History
| Date | Buyer | Sale Price | Title Company |
|---|---|---|---|
| Sayed Abu | -- | -- | |
| Sayed Abu | -- | -- | |
| Hossain Mohammed K | -- | -- | |
| Hossain Mohammed K | -- | -- | |
| Hossain Mohammed K | -- | -- | |
| Hossain Mohammed K | -- | -- | |
| Hossain Mohammed K | $285,000 | Fidelity National Title Ins | |
| Hossain Mohammed K | $285,000 | Fidelity National Title Ins | |
| Hsu Ming Chiang | -- | -- | |
| Hsu Ming Chiang | -- | -- |
Source: Public Records
Mortgage History
| Date | Status | Borrower | Loan Amount |
|---|---|---|---|
| Previous Owner | Hossain Mohammed K | $270,000 |
Source: Public Records
Tax History Compared to Growth
Tax History
| Year | Tax Paid | Tax Assessment Tax Assessment Total Assessment is a certain percentage of the fair market value that is determined by local assessors to be the total taxable value of land and additions on the property. | Land | Improvement |
|---|---|---|---|---|
| 2025 | $11,395 | $60,136 | $14,028 | $46,108 |
| 2024 | $11,395 | $56,732 | $15,862 | $40,870 |
| 2023 | $11,395 | $56,732 | $17,517 | $39,215 |
| 2022 | $11,240 | $71,880 | $21,120 | $50,760 |
| 2021 | $11,179 | $73,080 | $21,120 | $51,960 |
| 2020 | $10,607 | $80,340 | $21,120 | $59,220 |
| 2019 | $9,890 | $79,020 | $21,120 | $57,900 |
| 2018 | $9,637 | $47,277 | $14,127 | $33,150 |
| 2017 | $9,565 | $46,921 | $13,891 | $33,030 |
| 2016 | $8,849 | $46,921 | $13,891 | $33,030 |
| 2015 | $5,339 | $41,761 | $13,171 | $28,590 |
| 2014 | $5,339 | $39,398 | $14,269 | $25,129 |
Source: Public Records
Map
Nearby Homes
- 35-20 Leverich St Unit 209
- 35-20 Leverich St Unit 524
- 35-20 Leverich St Unit A201
- 35-20 Leverich St Unit B226
- 35-20 Leverich St Unit A504
- 3520 Leverich St Unit 212
- 70-35 Broadway Unit D10
- 70-35 Broadway Unit A10
- 7035 Broadway Unit A16
- 72-15 37th Ave Unit 4B
- 72-15 37th Ave Unit 3H
- 35-05 72nd St Unit 3G
- 35-05 72nd St Unit 2C
- 35-05 72nd St Unit 2E
- 35-05 72nd St Unit 4E
- 3550 73rd St
- 3530 73rd St Unit 6A
- 35-30 73rd St Unit 6-A
- 35-30 73rd St Unit 1 F
- 35-20 73rd St Unit 6R
- 3527 Leverich St
- 3535 Leverich St
- 35-35 Leverich St
- 3537 Leverich St
- 3539 Leverich St
- 3541 Leverich St
- 7110 35th Ave
- 3515 Leverich St
- 3543 Leverich St
- 3543 Leverich St
- 7104 35th Ave
- 3545 Leverich St
- 35-44 35 Rd
- 71-04 35th Ave
- 7102 35th Ave
- 7018 35th Ave
- 71-02 35th Ave
- 7104 35th Ave
- 7015 35th Rd
- 3506 71st St