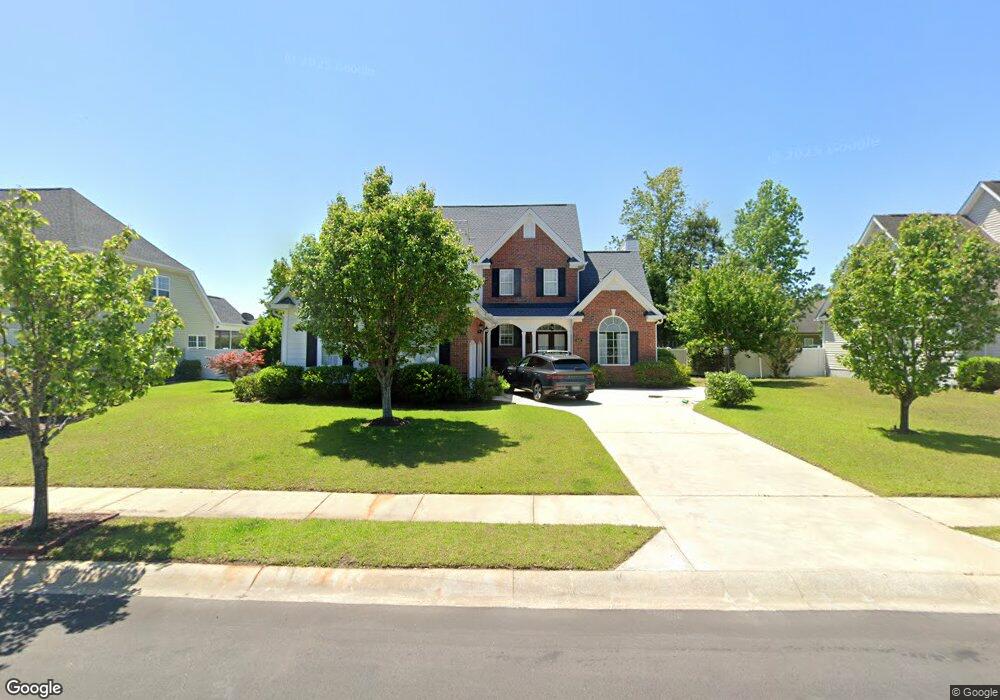
3532 Brampton Dr Unit The Gates at Surfsid Myrtle Beach, SC 29588
Burgess NeighborhoodEstimated Value: $492,000 - $551,000
3
Beds
3
Baths
3,337
Sq Ft
$159/Sq Ft
Est. Value
About This Home
This home is located at 3532 Brampton Dr Unit The Gates at Surfsid, Myrtle Beach, SC 29588 and is currently estimated at $529,040, approximately $158 per square foot. 3532 Brampton Dr Unit The Gates at Surfsid is a home located in Horry County with nearby schools including Burgess Elementary School, St. James Intermediate, and St. James Middle School.
Ownership History
Date
Name
Owned For
Owner Type
Purchase Details
Closed on
Jan 28, 2025
Sold by
Mcveigh Ellen J
Bought by
Mcveigh Ellen J and Mcveigh Ellen J
Current Estimated Value
Purchase Details
Closed on
Dec 27, 2023
Sold by
Mcveigh Terrence M
Bought by
Mcveigh Terrence Martin Trust and Mcveigh Ellen J Trust
Purchase Details
Closed on
Jan 27, 2023
Sold by
Saxon William E
Bought by
Mcveigh Terrence M and Mcveigh Ellen J
Purchase Details
Closed on
Nov 18, 2005
Sold by
Dawol Homes Inc
Bought by
Saxon William E and Saxon Rita V
Purchase Details
Closed on
Jun 9, 2005
Sold by
Classic Properties Of Charleston Llc
Bought by
Dawol Homes Inc
Home Financials for this Owner
Home Financials are based on the most recent Mortgage that was taken out on this home.
Original Mortgage
$258,000
Interest Rate
5.7%
Mortgage Type
Fannie Mae Freddie Mac
Create a Home Valuation Report for This Property
The Home Valuation Report is an in-depth analysis detailing your home's value as well as a comparison with similar homes in the area
Home Values in the Area
Average Home Value in this Area
Purchase History
| Date | Buyer | Sale Price | Title Company |
|---|---|---|---|
| Mcveigh Ellen J | -- | -- | |
| Mcveigh Ellen J | -- | -- | |
| Mcveigh Terrence Martin Trust | -- | -- | |
| Mcveigh Terrence M | $500,000 | -- | |
| Saxon William E | $330,657 | -- | |
| Dawol Homes Inc | $40,750 | -- |
Source: Public Records
Mortgage History
| Date | Status | Borrower | Loan Amount |
|---|---|---|---|
| Previous Owner | Dawol Homes Inc | $258,000 |
Source: Public Records
Tax History Compared to Growth
Tax History
| Year | Tax Paid | Tax Assessment Tax Assessment Total Assessment is a certain percentage of the fair market value that is determined by local assessors to be the total taxable value of land and additions on the property. | Land | Improvement |
|---|---|---|---|---|
| 2024 | $1,746 | $20,029 | $3,665 | $16,364 |
| 2023 | $6,127 | $13,142 | $2,108 | $11,034 |
| 2021 | $1,143 | $14,446 | $2,178 | $12,268 |
| 2020 | $1,014 | $14,446 | $2,178 | $12,268 |
| 2019 | $1,014 | $14,446 | $2,178 | $12,268 |
| 2018 | $889 | $11,427 | $1,831 | $9,596 |
| 2017 | $874 | $11,427 | $1,831 | $9,596 |
| 2016 | -- | $11,427 | $1,831 | $9,596 |
| 2015 | $874 | $11,428 | $1,832 | $9,596 |
| 2014 | $806 | $11,428 | $1,832 | $9,596 |
Source: Public Records
Map
Nearby Homes
- 3602 Brampton Dr
- 3607 Brampton Dr
- 3004 Waterbury Ln
- 914 Saluda River Rd
- 416 Seneca River Rd
- 915 Saluda River Rd
- 4002 Edenborough Dr
- 509 Acadian Way
- 154 Terracina Cir
- 933 Saluda River Rd
- 513 Reedy River Rd
- 3095 Gillham Loop
- 2024 Chadbury Ln
- 3107 Gillham Loop
- 3083 Gillham Loop
- 3821 Barrington Ln
- 2033 Chadbury Ln
- 2039 Chadbury Ln
- 124 Ashley River Rd
- 1008 Saluda River Rd Unit Lot 1032
- 3532 Brampton Dr
- 3532 Brampton Dr Unit The Gates
- 3528 Brampton Dr
- 3536 Brampton Dr
- 4209 Mynatt Ct Unit The Estates at The G
- 4209 Mynatt Ct
- 4209 Mynatt Ct Unit Lot 3 Estates@The Ga
- 4213 Mynatt Ct
- 4205 Mynatt Ct
- 1919 Bingham Ct
- 3524 Brampton Dr
- 3540 Brampton Dr
- 1909 Bingham Ct Unit The Gates PH 4
- 4217 Mynatt Ct
- 4127 Mynatt Ct
- 4201 Mynatt Ct
- 1905 Bingham Ct
- 4221 Mynatt Ct Unit 4221 Mynatt Court
- 4221 Mynatt Ct
- 1920 Bingham Ct