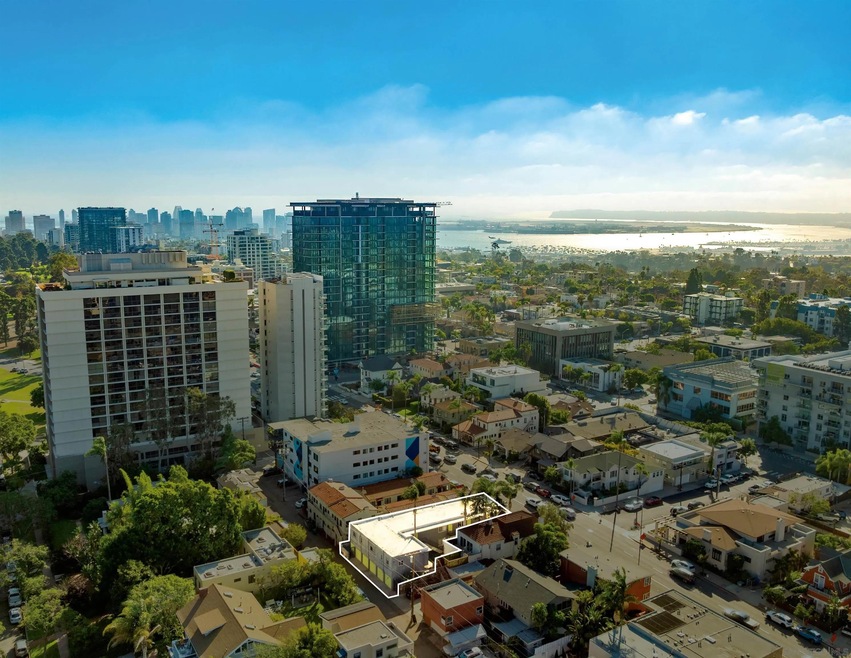
3533 6th Ave San Diego, CA 92103
Hillcrest NeighborhoodAbout This Home
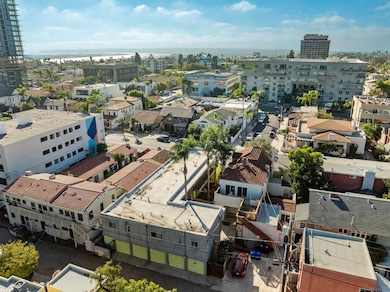
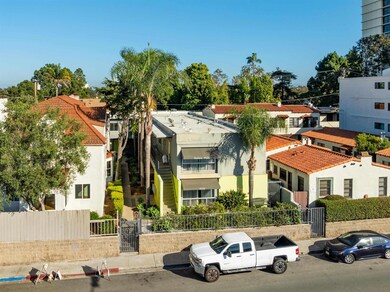
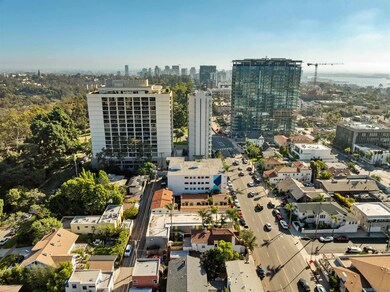
CBRE is pleased to present Balboa Flats, a well-maintained 10-unit multifamily property located at 3533 6th Avenue in the heart of San Diego’s prime Hillcrest neighborhood, at the edge of Bankers Hill and just one block from historic Balboa Park. Built in 1952, the asset offers an exceptional combination of location, stability, and value-add potential in one of the city’s most desirable rental corridors. Eight of ten units have been substantially improved with vinyl plank flooring, new countertops, stainless steel appliances, newer cabinetry and hardware, custom backsplash, and upgraded bathrooms. A TPO roof was completely replaced in 2012 with a 20-year warranty, and all systems are in good working condition.
Property Details
Home Type
- Multi-Family
Home Design
Interior Spaces
- 3 Bedrooms
- 4,952 Sq Ft Home
- 2-Story Property
Community Details
- 10 Units
- Operating Expense $87,914
Map
Home Values in the Area
Average Home Value in this Area
Tax History
| Year | Tax Paid | Tax Assessment Tax Assessment Total Assessment is a certain percentage of the fair market value that is determined by local assessors to be the total taxable value of land and additions on the property. | Land | Improvement |
|---|---|---|---|---|
| 2025 | $20,455 | $1,693,397 | $901,429 | $791,968 |
| 2024 | $20,455 | $1,660,194 | $883,754 | $776,440 |
| 2023 | $20,001 | $1,627,642 | $866,426 | $761,216 |
| 2022 | $19,468 | $1,595,729 | $849,438 | $746,291 |
| 2021 | $19,335 | $1,564,441 | $832,783 | $731,658 |
| 2020 | $19,101 | $1,548,400 | $824,244 | $724,156 |
| 2019 | $18,760 | $1,518,040 | $808,083 | $709,957 |
| 2018 | $17,538 | $1,488,276 | $792,239 | $696,037 |
| 2017 | $17,119 | $1,459,095 | $776,705 | $682,390 |
| 2016 | $16,843 | $1,430,486 | $761,476 | $669,010 |
| 2015 | $16,594 | $1,408,999 | $750,038 | $658,961 |
| 2014 | $16,335 | $1,381,399 | $735,346 | $646,053 |
Property History
| Date | Event | Price | List to Sale | Price per Sq Ft |
|---|---|---|---|---|
| 12/31/2025 12/31/25 | For Sale | $3,475,000 | 0.0% | $702 / Sq Ft |
| 12/16/2025 12/16/25 | Off Market | $3,475,000 | -- | -- |
| 12/09/2025 12/09/25 | Price Changed | $3,475,000 | -36.5% | $702 / Sq Ft |
| 10/29/2025 10/29/25 | For Sale | $5,475,000 | -- | $1,106 / Sq Ft |
Source: San Diego MLS
MLS Number: 250045419
APN: 452-430-07-00
Disclaimer: Certain information contained herein is derived from information provided by parties other than Homes.com. All information provided is deemed reliable, but is not guaranteed to be accurate and should be independently verified.
![]() This information is deemed reliable but not guaranteed. You should rely on this information only to decide whether or not to further investigate a particular property.
This information is deemed reliable but not guaranteed. You should rely on this information only to decide whether or not to further investigate a particular property.
BEFORE MAKING ANY OTHER DECISION, YOU SHOULD PERSONALLY INVESTIGATE THE FACTS (e.g. square footage and lot size) with the assistance of an appropriate professional. You may use this information only to identify properties you may be interested in investigating further. All uses except for personal, noncommercial use in accordance with the foregoing purpose are prohibited. Redistribution or copying of this information, any photographs or video tours is strictly
prohibited. This information is derived from the Internet Data Exchange (IDX) service provided by San Diego MLS. Displayed property listings may be held by a brokerage firm other than the broker and/or agent responsible for this display. The information and any photographs and video tours and the compilation from which they are derived is protected by copyright. Compilation © 2026 San Diego MLS.
- 510 Upas St
- 3635 7th Ave Unit 2D
- 3635 7th Ave Unit 13E
- 3634 7th Ave Unit 8E
- 3645 7th Ave Unit 305
- 3574 Fourth Ave
- 3663 7th Ave Unit 1
- 3650 5th Ave Unit 602
- 3650 5th Ave Unit 415
- 3650 5th Ave Unit 505
- 3650 5th Ave Unit 404
- 3641 8th Ave
- 307 Upas St
- 319 Upas St
- 3200 6th Ave Unit 205
- 3450 3rd Ave Unit 302
- 3687 4th Ave Unit 201
- 3687 4th Ave Unit 313
- 140 Walnut Ave Unit 4B
- 140 Walnut Ave Unit 2A
- 3415 6th Ave Unit 14
- 3534 5th Ave
- 555 Upas St
- 3630 6th Ave
- 3576 Fourth Ave
- 3580 4th Ave
- 3650 5th Ave Unit 415
- 3288 5th Ave
- 725 Pennsylvania Ave Unit 731
- 725 Pennsylvania Ave Unit 727-1
- 725 Pennsylvania Ave Unit 29
- 312 Brookes Ave Unit B1
- 312 Brookes Ave Unit A1
- 312 Brookes Ave Unit A2
- 312 Brookes Ave Unit B2
- 3535 1st Ave Unit 11C
- 3775 Sixth Ave
- 3700 10th Ave
- 635 Robinson Ave Unit SI FL6-ID56
- 635 Robinson Ave Unit SI FL4-ID9

Ask me questions while you tour the home.