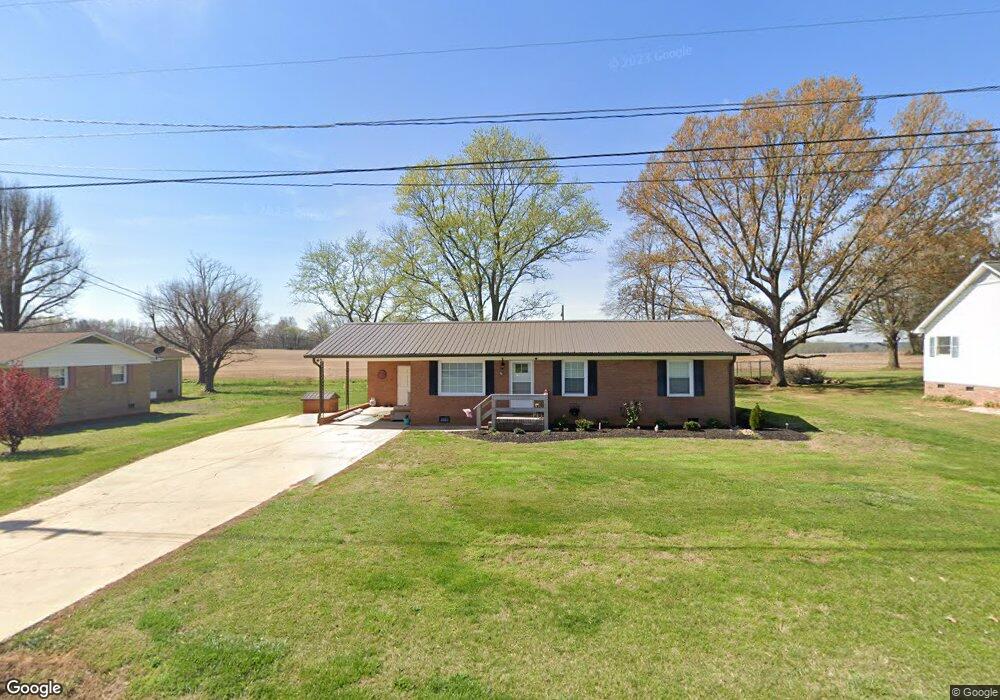
35339 Pickler Rd Albemarle, NC 28001
Estimated Value: $246,401 - $257,000
3
Beds
2
Baths
1,092
Sq Ft
$231/Sq Ft
Est. Value
About This Home
This home is located at 35339 Pickler Rd, Albemarle, NC 28001 and is currently estimated at $252,600, approximately $231 per square foot. 35339 Pickler Rd is a home located in Stanly County with nearby schools including Millingport Elementary School, North Stanly Middle School, and North Stanly High School.
Ownership History
Date
Name
Owned For
Owner Type
Purchase Details
Closed on
Mar 17, 2022
Sold by
Harwood John Malcolm and Aldridge Adam Lee
Bought by
Cranford Raymond R and Cranford Karen Jo
Current Estimated Value
Purchase Details
Closed on
Jul 29, 2021
Sold by
Glass Philip A
Bought by
Aldridge Adam Lee and Harwood John Malcolm
Create a Home Valuation Report for This Property
The Home Valuation Report is an in-depth analysis detailing your home's value as well as a comparison with similar homes in the area
Purchase History
| Date | Buyer | Sale Price | Title Company |
|---|---|---|---|
| Cranford Raymond R | $210,000 | Mabry Clegg | |
| Aldridge Adam Lee | $87,850 | Morrow & Britton Pllc |
Source: Public Records
Tax History
| Year | Tax Paid | Tax Assessment Tax Assessment Total Assessment is a certain percentage of the fair market value that is determined by local assessors to be the total taxable value of land and additions on the property. | Land | Improvement |
|---|---|---|---|---|
| 2025 | $899 | $153,085 | $23,850 | $129,235 |
| 2024 | $523 | $76,087 | $11,448 | $64,639 |
| 2023 | $620 | $76,087 | $11,448 | $64,639 |
| 2022 | $620 | $76,087 | $11,448 | $64,639 |
| 2021 | $630 | $76,087 | $11,448 | $64,639 |
| 2020 | $616 | $69,608 | $10,176 | $59,432 |
| 2019 | $617 | $69,608 | $10,176 | $59,432 |
| 2018 | $291 | $69,608 | $10,176 | $59,432 |
| 2017 | $520 | $69,608 | $10,176 | $59,432 |
| 2016 | $512 | $68,490 | $8,904 | $59,586 |
| 2015 | $600 | $68,490 | $8,904 | $59,586 |
| 2014 | $535 | $68,490 | $8,904 | $59,586 |
Source: Public Records
Map
Nearby Homes
- 29390 A Pennington Rd
- 2231 Snuggs Park Rd
- 33266 Courtland Dr
- 613 Bethany Rd
- 0 Snuggs Park Rd
- 2319 Tanglewood Dr
- 415 Brenda Dr
- 418 Woodcrest Ln
- 32874 Old Salisbury Rd
- 208 Ellis St
- 1604 Salisbury Ave
- 125 Lowder Rd
- 1416 Salisbury Ave
- 1315 Reid St
- 2812 Highway 52
- 1023 Autumn Ln
- 30497 Orchard Ln
- 1329 Columbus St
- 214 Knollwood Cir
- 1240 Hollywood Terrace
- 35347 Pickler Rd
- 35331 Pickler Rd
- 35355 Pickler Rd
- 35315 Pickler Rd
- 35307 Pickler Rd
- 36003 Pickler Rd
- 35366 Pickler Rd
- 35299 Pickler Rd
- 35296 Pickler Rd
- 35291 Pickler Rd
- 35275 Pickler Rd
- 36011 Pickler Rd
- 35267 Pickler Rd
- 35280 Pickler Rd
- 35259 Pickler Rd
- 36052 Pickler Rd
- 36134 Pickler Rd
- 35251 Pickler Rd
- 33673 Old Herlocker Rd
- 35243 Pickler Rd
Your Personal Tour Guide
Ask me questions while you tour the home.