Estimated Value: $148,000 - $271,000
3
Beds
3
Baths
1,540
Sq Ft
$122/Sq Ft
Est. Value
About This Home
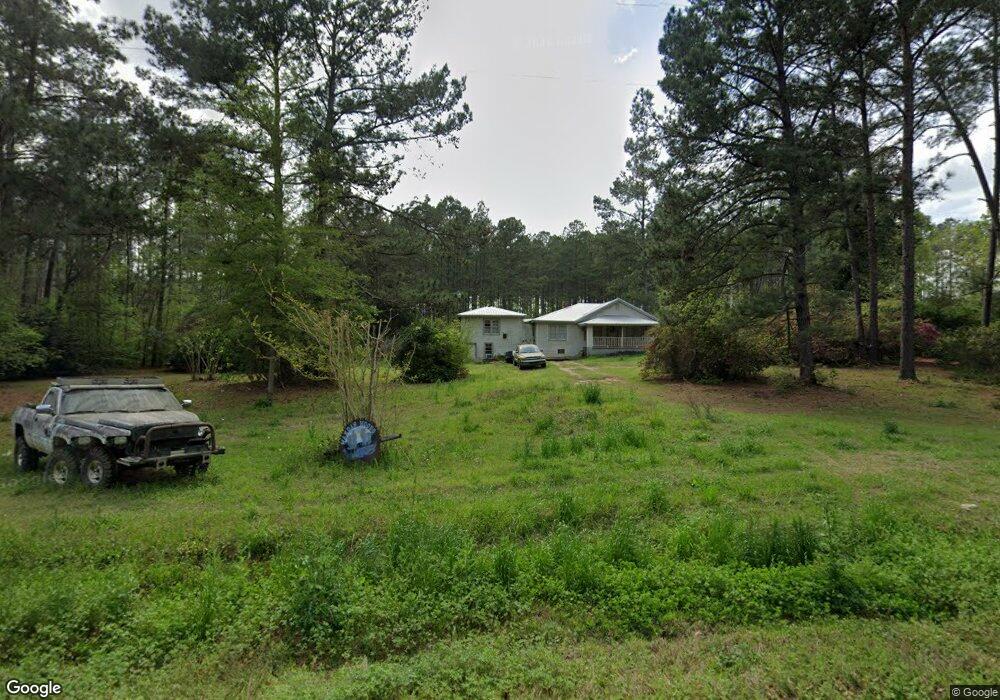
This home is located at 3535 Ga Highway 188 N, Cairo, GA 39827 and is currently estimated at $187,518, approximately $121 per square foot. 3535 Ga Highway 188 N is a home located in Grady County.
Ownership History
Date
Name
Owned For
Owner Type
Purchase Details
Closed on
Apr 26, 2019
Sold by
Mobley John Adam
Bought by
Mobley Daniel Joseph
Current Estimated Value
Purchase Details
Closed on
Mar 15, 2019
Sold by
Mobley John D
Bought by
Mobley Daniel Joseph and Mobley John Adam
Purchase Details
Closed on
Apr 5, 2013
Sold by
Mobley Jerry M
Bought by
Mobley John D
Purchase Details
Closed on
Apr 4, 2013
Sold by
Camarilo Judy W
Bought by
Mobley John D and Mobley Jeffrey H
Purchase Details
Closed on
Aug 16, 2006
Sold by
Boosinger Wanda W
Bought by
Camarilo Judy W
Purchase Details
Closed on
Oct 31, 1985
Bought by
Willis Wanda Faye
Create a Home Valuation Report for This Property
The Home Valuation Report is an in-depth analysis detailing your home's value as well as a comparison with similar homes in the area
Home Values in the Area
Average Home Value in this Area
Purchase History
| Date | Buyer | Sale Price | Title Company |
|---|---|---|---|
| Mobley Daniel Joseph | -- | -- | |
| Mobley Daniel Joseph | -- | -- | |
| Mobley John D | -- | -- | |
| Mobley John D | -- | -- | |
| Camarilo Judy W | -- | -- | |
| Willis Wanda Faye | $22,500 | -- |
Source: Public Records
Tax History Compared to Growth
Tax History
| Year | Tax Paid | Tax Assessment Tax Assessment Total Assessment is a certain percentage of the fair market value that is determined by local assessors to be the total taxable value of land and additions on the property. | Land | Improvement |
|---|---|---|---|---|
| 2024 | $1,041 | $33,824 | $3,630 | $30,194 |
| 2023 | $694 | $22,544 | $3,888 | $18,656 |
| 2022 | $694 | $22,544 | $3,888 | $18,656 |
| 2021 | $696 | $22,544 | $3,888 | $18,656 |
| 2020 | $699 | $22,544 | $3,888 | $18,656 |
| 2019 | $637 | $22,544 | $3,888 | $18,656 |
| 2018 | $598 | $22,544 | $3,888 | $18,656 |
| 2017 | $569 | $22,544 | $3,888 | $18,656 |
| 2016 | $482 | $19,304 | $3,888 | $15,416 |
| 2015 | $476 | $19,304 | $3,888 | $15,416 |
| 2014 | $477 | $19,304 | $3,888 | $15,416 |
| 2013 | -- | $19,820 | $5,400 | $14,420 |
Source: Public Records
Map
Nearby Homes
- 1210 Elkins Rd
- 3136 State Route 188
- 2427 Pierce Chapel Rd
- 1016 Richter Rd
- 38.02 ac Old Thomasville Rd
- 414 Woodland Rd
- 0 State Route 188
- 159 Cameron Rd
- 144 Mount Nebo Ln
- 186 Longleaf Ln
- 105 Woodridge Ln
- 0 NE Airport Rd Unit 145784
- 161 Evergreen Ln
- 158 Woodridge Ln
- 3109 U S 84
- 3109 U S 84
- 551 Woodridge Ln
- 264 Woodridge Ln
- 2600 U S 84
- 3496 Ga Highway 188 N Unit B
- 3582 Ga Highway 188 N
- 3606 Ga Highway 188 N
- 3452 State Route 188
- 3606 State Route 188
- 3450 Ga Highway 188 N
- 3458 Ga Highway 188 N
- 000 Ga Hwy 188 N
- 1188 Elkins Rd
- 1136 Elkins Rd
- 1194 Elkins Rd
- 3024 Pierce Chapel Rd
- 3452 Ga Highway 188 N Unit L2
- 3452 Ga Highway 188 N Unit L2
- 3452 Ga Highway 188 N
- 1256 Elkins Rd
- 2942 Pierce Chapel Rd Unit L3
- 146 Houston Ln N
- 3362 Ga Highway 188 N
- 3346 Ga Highway 188 N