3536 Flinthead Dr North Las Vegas, NV 89084
Aliante NeighborhoodEstimated Value: $397,131 - $418,000
2
Beds
2
Baths
1,570
Sq Ft
$260/Sq Ft
Est. Value
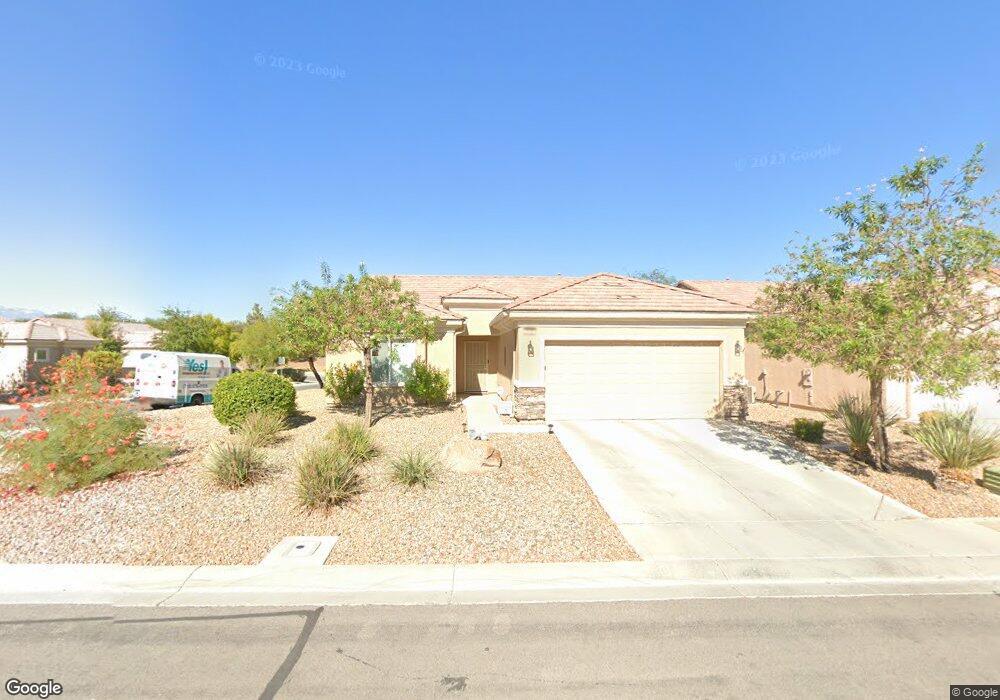
About This Home
This home is located at 3536 Flinthead Dr, North Las Vegas, NV 89084 and is currently estimated at $407,533, approximately $259 per square foot. 3536 Flinthead Dr is a home located in Clark County with nearby schools including Vincent L. Triggs Elementary School, Anthony Saville Middle School, and Shadow Ridge High School.
Ownership History
Date
Name
Owned For
Owner Type
Purchase Details
Closed on
Nov 7, 2006
Sold by
Livingston James
Bought by
James Edward Livingston Revocable Trust
Current Estimated Value
Purchase Details
Closed on
Jun 10, 2005
Sold by
Small Edward
Bought by
Livingston James
Home Financials for this Owner
Home Financials are based on the most recent Mortgage that was taken out on this home.
Original Mortgage
$50,000
Outstanding Balance
$26,036
Interest Rate
5.72%
Mortgage Type
Fannie Mae Freddie Mac
Estimated Equity
$381,497
Purchase Details
Closed on
Mar 30, 2004
Sold by
Pn Ii Inc
Bought by
Small Edward
Home Financials for this Owner
Home Financials are based on the most recent Mortgage that was taken out on this home.
Original Mortgage
$216,550
Interest Rate
4.5%
Mortgage Type
Unknown
Purchase Details
Closed on
Mar 25, 2004
Sold by
Small Lois
Bought by
Small Edward
Home Financials for this Owner
Home Financials are based on the most recent Mortgage that was taken out on this home.
Original Mortgage
$216,550
Interest Rate
4.5%
Mortgage Type
Unknown
Create a Home Valuation Report for This Property
The Home Valuation Report is an in-depth analysis detailing your home's value as well as a comparison with similar homes in the area
Home Values in the Area
Average Home Value in this Area
Purchase History
| Date | Buyer | Sale Price | Title Company |
|---|---|---|---|
| James Edward Livingston Revocable Trust | -- | None Available | |
| Livingston James | $275,000 | Fidelity National Title | |
| Small Edward | $227,987 | Lawyers Title Of Nevada | |
| Small Edward | -- | Lawyers Title Of Nevada |
Source: Public Records
Mortgage History
| Date | Status | Borrower | Loan Amount |
|---|---|---|---|
| Open | Livingston James | $50,000 | |
| Previous Owner | Small Edward | $216,550 |
Source: Public Records
Tax History Compared to Growth
Tax History
| Year | Tax Paid | Tax Assessment Tax Assessment Total Assessment is a certain percentage of the fair market value that is determined by local assessors to be the total taxable value of land and additions on the property. | Land | Improvement |
|---|---|---|---|---|
| 2025 | $1,944 | $98,735 | $29,400 | $69,335 |
| 2024 | $1,888 | $98,735 | $29,400 | $69,335 |
| 2023 | $1,888 | $97,129 | $31,605 | $65,524 |
| 2022 | $1,839 | $86,958 | $27,195 | $59,763 |
| 2021 | $1,788 | $80,975 | $24,255 | $56,720 |
| 2020 | $1,824 | $79,571 | $23,520 | $56,051 |
| 2019 | $1,771 | $76,475 | $21,315 | $55,160 |
| 2018 | $1,719 | $69,938 | $16,905 | $53,033 |
| 2017 | $2,315 | $68,169 | $15,400 | $52,769 |
| 2016 | $1,629 | $66,355 | $13,475 | $52,880 |
| 2015 | $1,625 | $53,523 | $10,780 | $42,743 |
| 2014 | $1,577 | $44,807 | $7,700 | $37,107 |
Source: Public Records
Map
Nearby Homes
- 3305 Flyway Ct
- 7633 Lily Trotter St
- 3705 Nesting Wren Dr
- 7649 Broadwing Dr
- 7616 Quail Dust St
- 7416 Redhead Dr
- 7713 Lily Trotter St
- 3805 Avian Ct
- 7381 Summer Duck Way
- 3821 Nesting Wren Dr
- 3109 Frigate Way
- 7332 Redhead Dr
- 3726 Snow Fawn Ave
- 7316 Bugler Swan Way
- 7312 Pinfeather Way
- 7617 Fieldfare Dr
- 7505 Java Sparrow St Unit 1
- 7264 Summer Duck Way
- 3220 Flinthead Dr
- 7741 Fruit Dove St Unit 4
- 3532 Flinthead Dr
- 7604 Broadwing Dr
- 3528 Flinthead Dr
- 7532 Lintwhite St
- 7541 Lintwhite St
- 7541 Lintwhite St
- 7541 Lintwhite St
- 7541 Lintwhite St
- 7545 Lintwhite St
- 7537 Lintwhite St
- 7608 Broadwing Dr Unit 4
- 3533 Flinthead Dr
- 7549 Lintwhite St
- 3524 Flinthead Dr
- 7528 Lintwhite St
- 7533 Lintwhite St
- 3529 Flinthead Dr Unit 4
- 7612 Broadwing Dr Unit 4
- 3525 Flinthead Dr Unit 4
- 7529 Lintwhite St