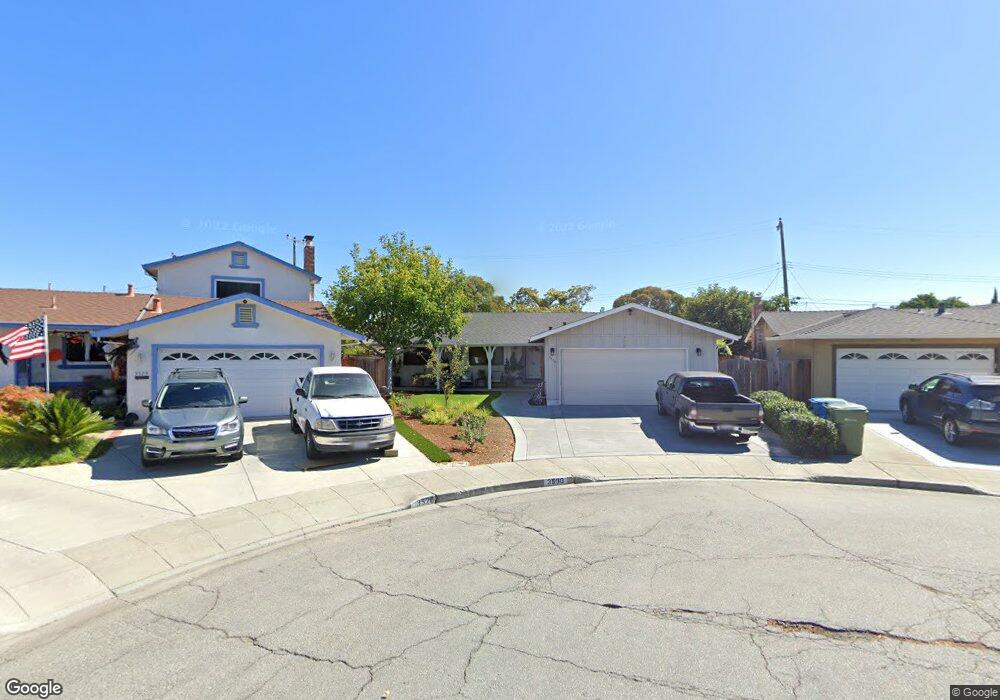
3536 Rowena Ct Santa Clara, CA 95054
North Santa Clara NeighborhoodEstimated Value: $1,439,000 - $1,540,000
4
Beds
2
Baths
1,244
Sq Ft
$1,198/Sq Ft
Est. Value
About This Home
This home is located at 3536 Rowena Ct, Santa Clara, CA 95054 and is currently estimated at $1,489,884, approximately $1,197 per square foot. 3536 Rowena Ct is a home located in Santa Clara County with nearby schools including Montague Elementary School, Buchser Middle School, and Santa Clara High School.
Ownership History
Date
Name
Owned For
Owner Type
Purchase Details
Closed on
May 5, 2011
Sold by
Martin Patricia and Martin Patricia N
Bought by
Headley Jordan James and Headley Jessica M
Current Estimated Value
Home Financials for this Owner
Home Financials are based on the most recent Mortgage that was taken out on this home.
Original Mortgage
$427,450
Outstanding Balance
$296,510
Interest Rate
4.84%
Mortgage Type
New Conventional
Estimated Equity
$1,193,374
Purchase Details
Closed on
Jul 12, 1982
Sold by
Martin Patricia N
Bought by
City Of Santa Clara
Create a Home Valuation Report for This Property
The Home Valuation Report is an in-depth analysis detailing your home's value as well as a comparison with similar homes in the area
Home Values in the Area
Average Home Value in this Area
Purchase History
| Date | Buyer | Sale Price | Title Company |
|---|---|---|---|
| Headley Jordan James | $475,000 | Fidelity National Title Co | |
| City Of Santa Clara | -- | None Available |
Source: Public Records
Mortgage History
| Date | Status | Borrower | Loan Amount |
|---|---|---|---|
| Open | Headley Jordan James | $427,450 |
Source: Public Records
Tax History
| Year | Tax Paid | Tax Assessment Tax Assessment Total Assessment is a certain percentage of the fair market value that is determined by local assessors to be the total taxable value of land and additions on the property. | Land | Improvement |
|---|---|---|---|---|
| 2025 | $7,073 | $608,547 | $365,131 | $243,416 |
| 2024 | $7,073 | $596,616 | $357,972 | $238,644 |
| 2023 | $7,002 | $584,918 | $350,953 | $233,965 |
| 2022 | $6,895 | $573,450 | $344,072 | $229,378 |
| 2021 | $6,867 | $562,207 | $337,326 | $224,881 |
| 2020 | $6,741 | $556,444 | $333,868 | $222,576 |
| 2019 | $6,735 | $545,534 | $327,322 | $218,212 |
| 2018 | $6,305 | $534,838 | $320,904 | $213,934 |
| 2017 | $6,273 | $524,352 | $314,612 | $209,740 |
| 2016 | $6,165 | $514,072 | $308,444 | $205,628 |
| 2015 | $6,142 | $506,351 | $303,811 | $202,540 |
| 2014 | $5,835 | $496,433 | $297,860 | $198,573 |
Source: Public Records
Map
Nearby Homes
- 3766 Pinewood Place
- 541 Woodstock Way
- 3736 Eastwood Cir
- 575 Moreland Way
- 1883 Agnew Rd Unit 311
- 1883 Agnew Rd Unit 112
- 2200 Agnew Rd Unit 318
- 1933 Silva Place
- 1215 Kelley Way Unit 79
- 4325 Watson Cir
- 2252 Creek Bed Ct
- 4424 Lick Mill Blvd
- 2235 3rd St
- 4663 Mangrum Dr
- 2130 Payne Place
- 4692 Wilcox Ave
- 297 Montague Expy
- 323 Montague Expy
- 4918 Avenida de Los Arboles
- 2186 Pasetta Dr
Your Personal Tour Guide
Ask me questions while you tour the home.