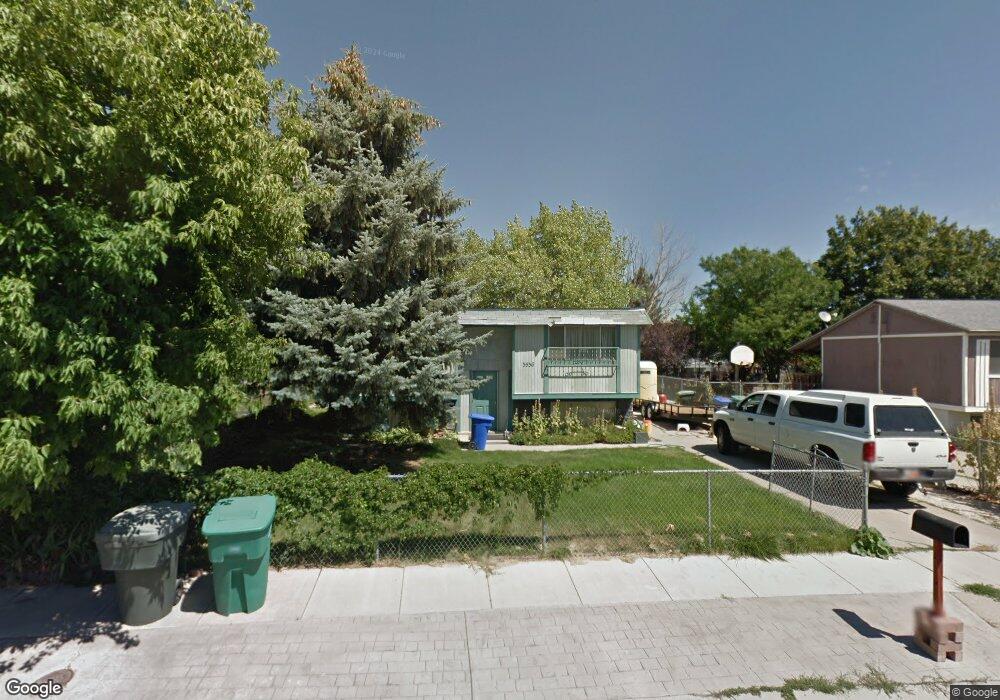
3536 W 8280 S West Jordan, UT 84088
Estimated Value: $444,000 - $481,026
4
Beds
2
Baths
1,644
Sq Ft
$283/Sq Ft
Est. Value
About This Home
This home is located at 3536 W 8280 S, West Jordan, UT 84088 and is currently estimated at $465,257, approximately $283 per square foot. 3536 W 8280 S is a home located in Salt Lake County with nearby schools including Terra Linda Elementary School, Joel P. Jensen Middle School, and West Jordan High School.
Ownership History
Date
Name
Owned For
Owner Type
Purchase Details
Closed on
Aug 29, 2022
Sold by
Porter Brooks S
Bought by
Solorzano Fernando N and Vargas Sebastian F
Current Estimated Value
Home Financials for this Owner
Home Financials are based on the most recent Mortgage that was taken out on this home.
Original Mortgage
$446,250
Outstanding Balance
$426,510
Interest Rate
5.3%
Mortgage Type
New Conventional
Estimated Equity
$38,747
Purchase Details
Closed on
Oct 30, 2018
Sold by
Hardman Calvin R and Hardman Edith B
Bought by
Porter Brooks S
Home Financials for this Owner
Home Financials are based on the most recent Mortgage that was taken out on this home.
Original Mortgage
$221,950
Interest Rate
4.75%
Mortgage Type
FHA
Create a Home Valuation Report for This Property
The Home Valuation Report is an in-depth analysis detailing your home's value as well as a comparison with similar homes in the area
Home Values in the Area
Average Home Value in this Area
Purchase History
| Date | Buyer | Sale Price | Title Company |
|---|---|---|---|
| Solorzano Fernando N | -- | -- | |
| Porter Brooks S | -- | Vangauard Title |
Source: Public Records
Mortgage History
| Date | Status | Borrower | Loan Amount |
|---|---|---|---|
| Open | Solorzano Fernando N | $446,250 | |
| Previous Owner | Porter Brooks S | $221,950 |
Source: Public Records
Tax History Compared to Growth
Tax History
| Year | Tax Paid | Tax Assessment Tax Assessment Total Assessment is a certain percentage of the fair market value that is determined by local assessors to be the total taxable value of land and additions on the property. | Land | Improvement |
|---|---|---|---|---|
| 2025 | $2,291 | $446,400 | $105,500 | $340,900 |
| 2024 | $2,291 | $440,800 | $102,400 | $338,400 |
| 2023 | $2,243 | $406,800 | $95,800 | $311,000 |
| 2022 | $1,886 | $336,500 | $93,900 | $242,600 |
| 2021 | $1,614 | $262,100 | $69,500 | $192,600 |
| 2020 | $1,617 | $246,500 | $69,500 | $177,000 |
| 2019 | $1,582 | $236,500 | $69,500 | $167,000 |
| 2018 | $1,350 | $200,100 | $65,500 | $134,600 |
| 2017 | $1,226 | $180,900 | $65,500 | $115,400 |
| 2016 | $1,170 | $162,200 | $65,500 | $96,700 |
| 2015 | $1,144 | $154,600 | $64,900 | $89,700 |
| 2014 | $1,092 | $145,300 | $61,800 | $83,500 |
Source: Public Records
Map
Nearby Homes
- 8180 S Old Bingham Hwy
- 8461 S Meadowlark Ln
- 8058 S Lismore Ln Unit 304
- 3546 W 7980 S
- 3332 Lower Newark Way
- 7991 S 3725 W
- 7989 S 3725 W
- 3476 W Spaulding Rd
- 8493 S 3200 W
- 3647 W 7865 S
- 3977 W Elwood Way
- 3112 Green Acre Dr
- 3629 W 7825 S
- 8400 S 4000 W Unit 134
- 8407 Meadow Green Way
- 3888 W 8700 S
- 3354 W 7800 S
- 3931 W Dansere Cir
- 3422 Briar Dr
- 3066 W Linton Dr