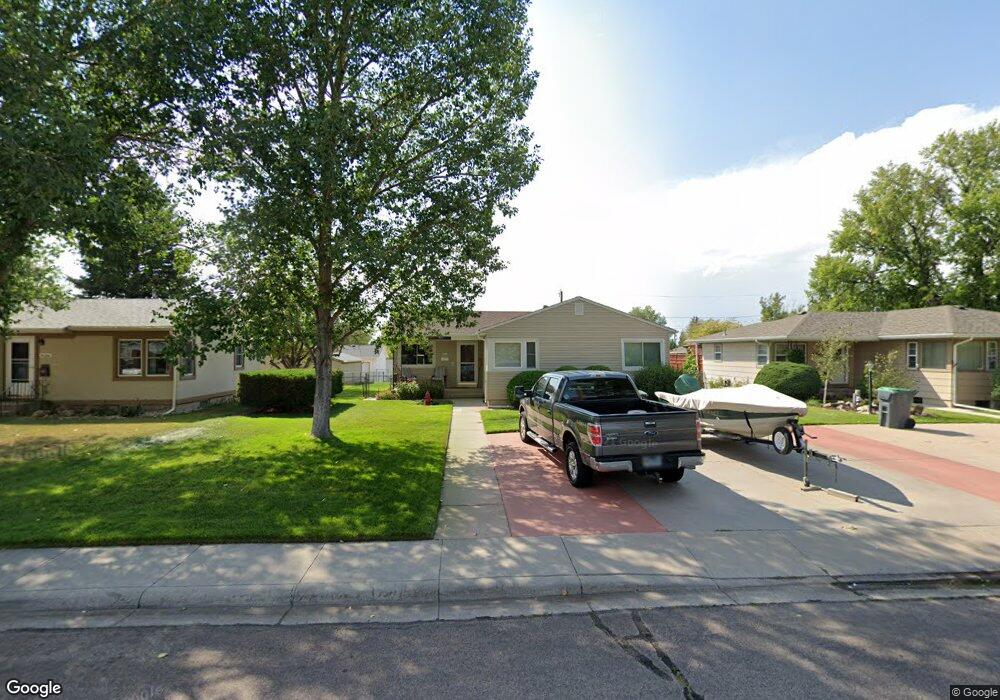
3538 Boston Rd Cheyenne, WY 82001
Estimated Value: $343,000 - $384,000
--
Bed
--
Bath
1,143
Sq Ft
$317/Sq Ft
Est. Value
About This Home
This home is located at 3538 Boston Rd, Cheyenne, WY 82001 and is currently estimated at $362,746, approximately $317 per square foot. 3538 Boston Rd is a home located in Laramie County with nearby schools including Henderson Elementary School, Carey Junior High School, and East High School.
Create a Home Valuation Report for This Property
The Home Valuation Report is an in-depth analysis detailing your home's value as well as a comparison with similar homes in the area
Home Values in the Area
Average Home Value in this Area
Tax History Compared to Growth
Tax History
| Year | Tax Paid | Tax Assessment Tax Assessment Total Assessment is a certain percentage of the fair market value that is determined by local assessors to be the total taxable value of land and additions on the property. | Land | Improvement |
|---|---|---|---|---|
| 2025 | $2,010 | $17,361 | $2,149 | $15,212 |
| 2024 | $2,010 | $31,421 | $4,299 | $27,122 |
| 2023 | $2,047 | $31,953 | $4,299 | $27,654 |
| 2022 | $1,716 | $26,767 | $4,299 | $22,468 |
| 2021 | $1,610 | $25,260 | $4,299 | $20,961 |
| 2020 | $1,397 | $22,360 | $4,299 | $18,061 |
| 2019 | $1,345 | $21,623 | $4,299 | $17,324 |
| 2018 | $1,193 | $19,674 | $3,964 | $15,710 |
| 2017 | $1,160 | $19,077 | $3,964 | $15,113 |
| 2016 | $1,070 | $17,821 | $3,762 | $14,059 |
| 2015 | $982 | $16,589 | $3,762 | $12,827 |
| 2014 | $1,040 | $17,309 | $3,762 | $13,547 |
Source: Public Records
Map
Nearby Homes
- 3561 Amherst Rd
- 3561 Boston Rd
- 1502 Andover Dr
- 3533 Duff Ave
- 1210 E 5th Ave
- 1770 Andover Dr
- 1120 Black Ct
- 1763 Milton Dr
- 1214 E 23rd St
- 2114 Rollins Ave
- 1847 Milton Dr
- 1208 E 22nd St
- 1859 Cheshire Dr
- 1115 E 23rd St
- 3700 Essex Rd
- 2013 Dunn Ave
- 1100 E 22nd St
- 1958 Newton Dr
- 1920 E 22nd St
- 2004 E 22nd St
- 3534 Boston Rd
- 3544 Boston Rd
- 3548 Boston Rd
- 3528 Boston Rd
- 3539 Amherst Rd
- 3533 Amherst Rd
- 3545 Amherst Rd
- 3552 Boston Rd
- 3522 Boston Rd
- 3529 Amherst Rd
- 3549 Amherst Rd
- 3539 Boston Rd
- 3533 Boston Rd
- 3549 Boston Rd
- 3529 Boston Rd
- 3553 Amherst Rd
- 3523 Amherst Rd
- 3560 Boston Rd
- 3512 Boston Rd
- 3555 Boston Rd