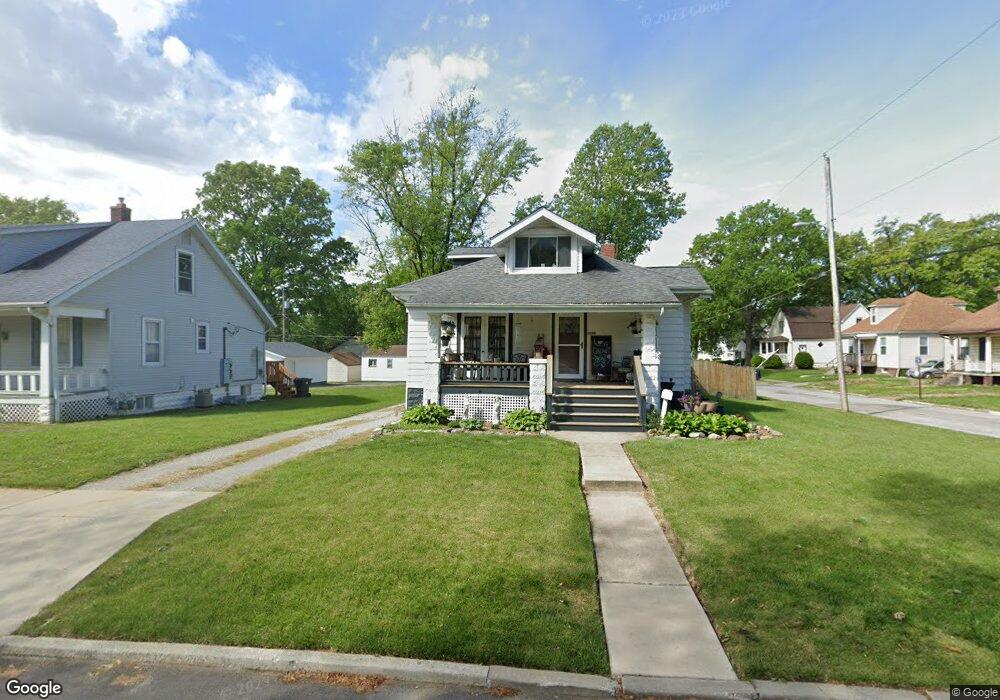
3538 Summit Ave Belleville, IL 62226
Estimated Value: $113,000 - $132,000
Studio
--
Bath
1,015
Sq Ft
$118/Sq Ft
Est. Value
About This Home
This home is located at 3538 Summit Ave, Belleville, IL 62226 and is currently estimated at $119,438, approximately $117 per square foot. 3538 Summit Ave is a home located in St. Clair County with nearby schools including Union Elementary School, West Jr High School, and Our Lady Queen Of Peace Catholic School.
Ownership History
Date
Name
Owned For
Owner Type
Purchase Details
Closed on
Mar 28, 2003
Sold by
Causey Michael W P and Causey Angela N
Bought by
Levery Eric S and Levery Geri B
Current Estimated Value
Home Financials for this Owner
Home Financials are based on the most recent Mortgage that was taken out on this home.
Original Mortgage
$83,889
Outstanding Balance
$36,567
Interest Rate
5.95%
Mortgage Type
FHA
Estimated Equity
$82,871
Purchase Details
Closed on
May 24, 2001
Sold by
Bassler David C and Bassler Janice M
Bought by
Causey Michael W P and Causey Angela N
Create a Home Valuation Report for This Property
The Home Valuation Report is an in-depth analysis detailing your home's value as well as a comparison with similar homes in the area
Home Values in the Area
Average Home Value in this Area
Purchase History
| Date | Buyer | Sale Price | Title Company |
|---|---|---|---|
| Levery Eric S | $87,000 | Town & Country Title Co | |
| Causey Michael W P | -- | -- |
Source: Public Records
Mortgage History
| Date | Status | Borrower | Loan Amount |
|---|---|---|---|
| Open | Levery Eric S | $83,889 |
Source: Public Records
Tax History
| Year | Tax Paid | Tax Assessment Tax Assessment Total Assessment is a certain percentage of the fair market value that is determined by local assessors to be the total taxable value of land and additions on the property. | Land | Improvement |
|---|---|---|---|---|
| 2024 | $2,926 | $33,273 | $1,822 | $31,451 |
| 2023 | $2,916 | $31,066 | $1,786 | $29,280 |
| 2022 | $2,677 | $27,967 | $1,608 | $26,359 |
| 2021 | $2,578 | $25,855 | $1,487 | $24,368 |
| 2020 | $2,506 | $24,450 | $1,406 | $23,044 |
| 2019 | $2,376 | $22,935 | $1,408 | $21,527 |
| 2018 | $2,323 | $22,440 | $1,378 | $21,062 |
| 2017 | $2,305 | $22,282 | $1,368 | $20,914 |
| 2016 | $2,276 | $21,809 | $1,339 | $20,470 |
| 2014 | $2,054 | $22,217 | $1,768 | $20,449 |
| 2013 | $2,033 | $22,534 | $1,793 | $20,741 |
Source: Public Records
Map
Nearby Homes
Your Personal Tour Guide
Ask me questions while you tour the home.