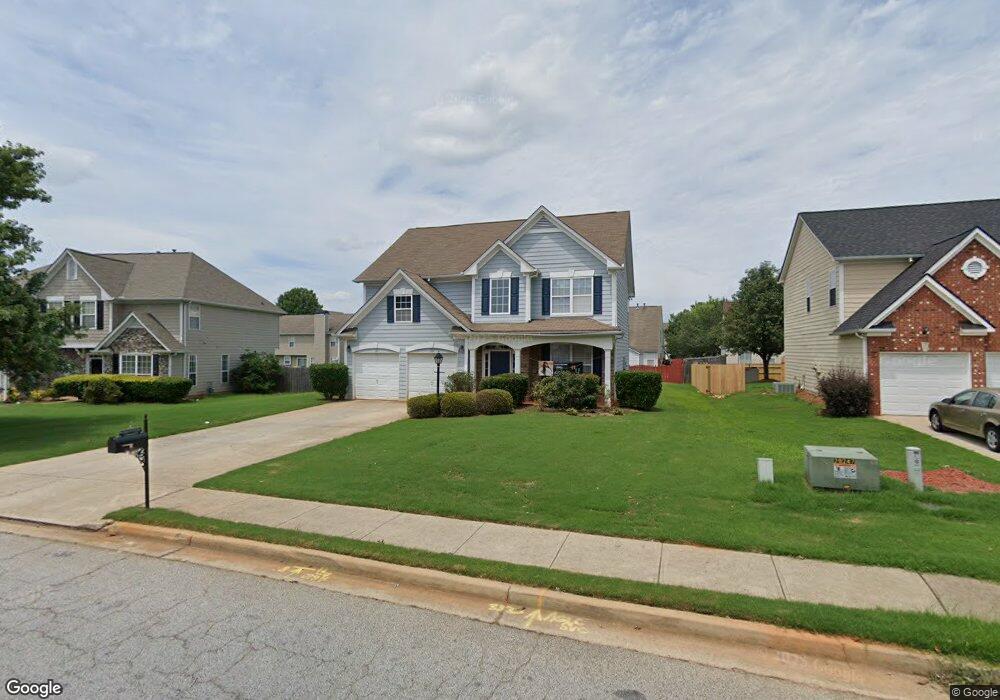
3539 Lighthouse Way Conyers, GA 30013
Estimated Value: $301,406 - $351,000
4
Beds
3
Baths
2,448
Sq Ft
$131/Sq Ft
Est. Value
About This Home
This home is located at 3539 Lighthouse Way, Conyers, GA 30013 and is currently estimated at $319,602, approximately $130 per square foot. 3539 Lighthouse Way is a home located in Rockdale County with nearby schools including Peek's Chapel Elementary School, Memorial Middle School, and Salem High School.
Ownership History
Date
Name
Owned For
Owner Type
Purchase Details
Closed on
Jul 14, 2006
Sold by
Fannie Mae
Bought by
Buchanan Desreen
Current Estimated Value
Home Financials for this Owner
Home Financials are based on the most recent Mortgage that was taken out on this home.
Original Mortgage
$144,000
Outstanding Balance
$84,969
Interest Rate
6.54%
Mortgage Type
New Conventional
Estimated Equity
$234,633
Purchase Details
Closed on
Dec 6, 2005
Sold by
Netbank
Bought by
Federal National Mortgage Association
Purchase Details
Closed on
Mar 24, 2003
Sold by
Inc-Torrey D R Horton
Bought by
Grice Stephanie T
Home Financials for this Owner
Home Financials are based on the most recent Mortgage that was taken out on this home.
Original Mortgage
$164,325
Interest Rate
5.82%
Mortgage Type
New Conventional
Create a Home Valuation Report for This Property
The Home Valuation Report is an in-depth analysis detailing your home's value as well as a comparison with similar homes in the area
Home Values in the Area
Average Home Value in this Area
Purchase History
| Date | Buyer | Sale Price | Title Company |
|---|---|---|---|
| Buchanan Desreen | -- | -- | |
| Federal National Mortgage Association | -- | -- | |
| Netbank | $176,195 | -- | |
| Grice Stephanie T | $164,400 | -- |
Source: Public Records
Mortgage History
| Date | Status | Borrower | Loan Amount |
|---|---|---|---|
| Open | Buchanan Desreen | $144,000 | |
| Previous Owner | Grice Stephanie T | $164,325 |
Source: Public Records
Tax History Compared to Growth
Tax History
| Year | Tax Paid | Tax Assessment Tax Assessment Total Assessment is a certain percentage of the fair market value that is determined by local assessors to be the total taxable value of land and additions on the property. | Land | Improvement |
|---|---|---|---|---|
| 2024 | $3,576 | $143,520 | $23,920 | $119,600 |
| 2023 | $3,174 | $132,400 | $24,640 | $107,760 |
| 2022 | $2,511 | $106,560 | $20,200 | $86,360 |
| 2021 | $2,020 | $82,520 | $12,200 | $70,320 |
| 2020 | $1,808 | $73,720 | $11,680 | $62,040 |
| 2019 | $1,513 | $62,680 | $8,400 | $54,280 |
| 2018 | $1,463 | $60,760 | $8,400 | $52,360 |
| 2017 | $1,348 | $56,480 | $7,760 | $48,720 |
| 2016 | $984 | $47,400 | $6,600 | $40,800 |
| 2015 | $891 | $44,120 | $6,080 | $38,040 |
| 2014 | $629 | $37,360 | $4,880 | $32,480 |
| 2013 | -- | $61,040 | $9,600 | $51,440 |
Source: Public Records
Map
Nearby Homes
- 3803 Yorkshire Ct
- 3121 Baywood Ct
- 3639 Cape Ln
- 2628 Essex Ct
- 2649 Fieldstone View Ln SE Unit A
- 2585 Golfview Terrace SE
- 2340 Jennas Way SE
- 1646 Ellington Rd SE
- 2145 Country Walk Way SE
- 2323 Benji Blvd SE
- 2365 Brentmoore Point Unit 3
- 2335 Ettas Cir SE
- 2042 Avalon Blvd
- 2246 Exchange Place SE
- 2112 Bradford Pear Cir SE
- 2303 Deerfield Chase SE Unit 5
- 2226 Exchange Place SE
- 2251 Country Club Dr SE Unit 1
- 2320 Deerfield Chase SE Unit 5
- 3095 Brombley Dr SE
- 3535 Lighthouse Way
- 3543 Lighthouse Way
- 3276 Quincey Crossing
- 3272 Quincey Crossing
- 3531 Lighthouse Way
- 3280 Quincey Crossing
- 3547 Lighthouse Way
- 3547 Lighthouse Way SE Unit 289
- 3268 Quincey Crossing
- 3540 Lighthouse Way
- 3284 Quincey Crossing
- 3536 Lighthouse Way
- 3544 Lighthouse Way
- 3527 Lighthouse Way
- 3527 Lighthouse Way SE
- 3532 Lighthouse Way
- 3288 Quincey Crossing
- 3551 Lighthouse Way
- 3264 Quincey Crossing
- 3548 Lighthouse Way