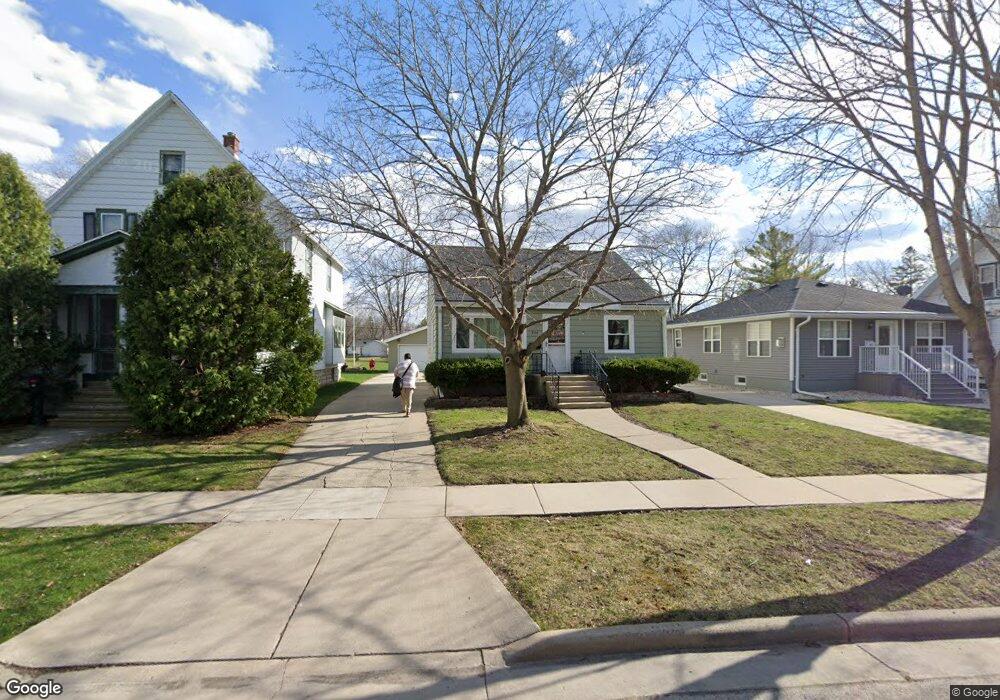
354 3rd St Fond Du Lac, WI 54935
Estimated Value: $189,000 - $202,000
2
Beds
1
Bath
1,013
Sq Ft
$191/Sq Ft
Est. Value
About This Home
This home is located at 354 3rd St, Fond Du Lac, WI 54935 and is currently estimated at $193,821, approximately $191 per square foot. 354 3rd St is a home located in Fond du Lac County with nearby schools including Roberts Elementary School, Woodworth Middle School, and Fond du Lac High School.
Ownership History
Date
Name
Owned For
Owner Type
Purchase Details
Closed on
Jul 25, 2016
Sold by
Hering Nathan D
Bought by
Wicihowski Steven P and Burns Rachel A
Current Estimated Value
Home Financials for this Owner
Home Financials are based on the most recent Mortgage that was taken out on this home.
Original Mortgage
$106,700
Outstanding Balance
$11,362
Interest Rate
3.41%
Mortgage Type
New Conventional
Estimated Equity
$182,459
Purchase Details
Closed on
Jun 18, 2015
Sold by
Hering Nathan D and Hering Amanda L
Bought by
Hering Nathan D
Purchase Details
Closed on
Feb 11, 2005
Sold by
Dikeman Angeline M and Bodoh Angeline M
Bought by
Hering Nathan D and Hering Amanda L
Home Financials for this Owner
Home Financials are based on the most recent Mortgage that was taken out on this home.
Original Mortgage
$70,400
Interest Rate
5.25%
Mortgage Type
Adjustable Rate Mortgage/ARM
Create a Home Valuation Report for This Property
The Home Valuation Report is an in-depth analysis detailing your home's value as well as a comparison with similar homes in the area
Home Values in the Area
Average Home Value in this Area
Purchase History
| Date | Buyer | Sale Price | Title Company |
|---|---|---|---|
| Wicihowski Steven P | $110,000 | None Available | |
| Hering Nathan D | -- | First American Title Ins Co | |
| Hering Nathan D | $88,000 | None Available |
Source: Public Records
Mortgage History
| Date | Status | Borrower | Loan Amount |
|---|---|---|---|
| Open | Wicihowski Steven P | $106,700 | |
| Previous Owner | Hering Nathan D | $70,400 |
Source: Public Records
Tax History Compared to Growth
Tax History
| Year | Tax Paid | Tax Assessment Tax Assessment Total Assessment is a certain percentage of the fair market value that is determined by local assessors to be the total taxable value of land and additions on the property. | Land | Improvement |
|---|---|---|---|---|
| 2024 | $2,492 | $105,700 | $17,100 | $88,600 |
| 2023 | $2,394 | $105,700 | $17,100 | $88,600 |
| 2022 | $2,280 | $105,700 | $17,100 | $88,600 |
| 2021 | $2,270 | $105,700 | $17,100 | $88,600 |
| 2020 | $2,313 | $105,700 | $17,100 | $88,600 |
| 2019 | $2,285 | $105,700 | $17,100 | $88,600 |
| 2018 | $2,039 | $88,300 | $17,100 | $71,200 |
| 2017 | $2,045 | $88,300 | $17,100 | $71,200 |
| 2016 | $1,856 | $80,700 | $17,100 | $63,600 |
| 2015 | $1,885 | $80,700 | $17,100 | $63,600 |
| 2014 | $1,829 | $80,700 | $17,100 | $63,600 |
| 2013 | $1,970 | $86,100 | $20,000 | $66,100 |
Source: Public Records
Map
Nearby Homes