354 9th St Unit 206 N. College Stree Lincoln, IL 62656
Estimated Value: $131,000 - $166,000
3
Beds
--
Bath
1,657
Sq Ft
$89/Sq Ft
Est. Value
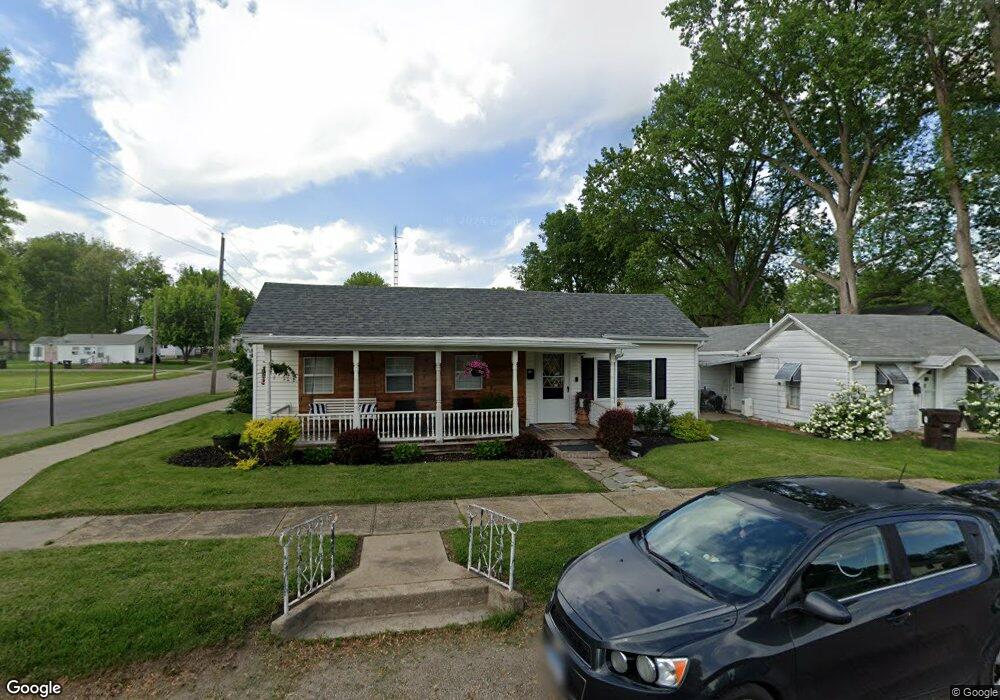
About This Home
This home is located at 354 9th St Unit 206 N. College Stree, Lincoln, IL 62656 and is currently estimated at $147,980, approximately $89 per square foot. 354 9th St Unit 206 N. College Stree is a home located in Logan County with nearby schools including Northwest Elementary School, Lincoln Junior High School, and Lincoln Community High School.
Ownership History
Date
Name
Owned For
Owner Type
Purchase Details
Closed on
Nov 17, 2014
Sold by
Gillum Rhonda S
Bought by
Diberardino Nicholas A and Diberardino Molly
Current Estimated Value
Home Financials for this Owner
Home Financials are based on the most recent Mortgage that was taken out on this home.
Original Mortgage
$10,000
Outstanding Balance
$7,652
Interest Rate
3.97%
Mortgage Type
Stand Alone First
Estimated Equity
$140,328
Create a Home Valuation Report for This Property
The Home Valuation Report is an in-depth analysis detailing your home's value as well as a comparison with similar homes in the area
Home Values in the Area
Average Home Value in this Area
Purchase History
| Date | Buyer | Sale Price | Title Company |
|---|---|---|---|
| Diberardino Nicholas A | $81,500 | -- |
Source: Public Records
Mortgage History
| Date | Status | Borrower | Loan Amount |
|---|---|---|---|
| Open | Diberardino Nicholas A | $10,000 | |
| Open | Diberardino Nicholas A | $72,959 |
Source: Public Records
Tax History Compared to Growth
Tax History
| Year | Tax Paid | Tax Assessment Tax Assessment Total Assessment is a certain percentage of the fair market value that is determined by local assessors to be the total taxable value of land and additions on the property. | Land | Improvement |
|---|---|---|---|---|
| 2024 | $2,387 | $32,390 | $5,940 | $26,450 |
| 2023 | $2,237 | $29,990 | $5,500 | $24,490 |
| 2022 | $2,136 | $27,960 | $5,130 | $22,830 |
| 2021 | $2,042 | $26,920 | $4,940 | $21,980 |
| 2020 | $2,045 | $26,920 | $4,940 | $21,980 |
| 2019 | $1,991 | $26,390 | $4,840 | $21,550 |
| 2018 | $1,915 | $25,370 | $4,650 | $20,720 |
| 2017 | $1,905 | $25,370 | $4,650 | $20,720 |
| 2016 | $1,886 | $25,660 | $4,700 | $20,960 |
| 2015 | $2,454 | $26,220 | $4,530 | $21,690 |
| 2014 | $2,454 | $26,220 | $4,530 | $21,690 |
| 2013 | $2,454 | $24,200 | $4,180 | $20,020 |
| 2012 | $2,454 | $24,550 | $4,240 | $20,310 |
Source: Public Records
Map
Nearby Homes