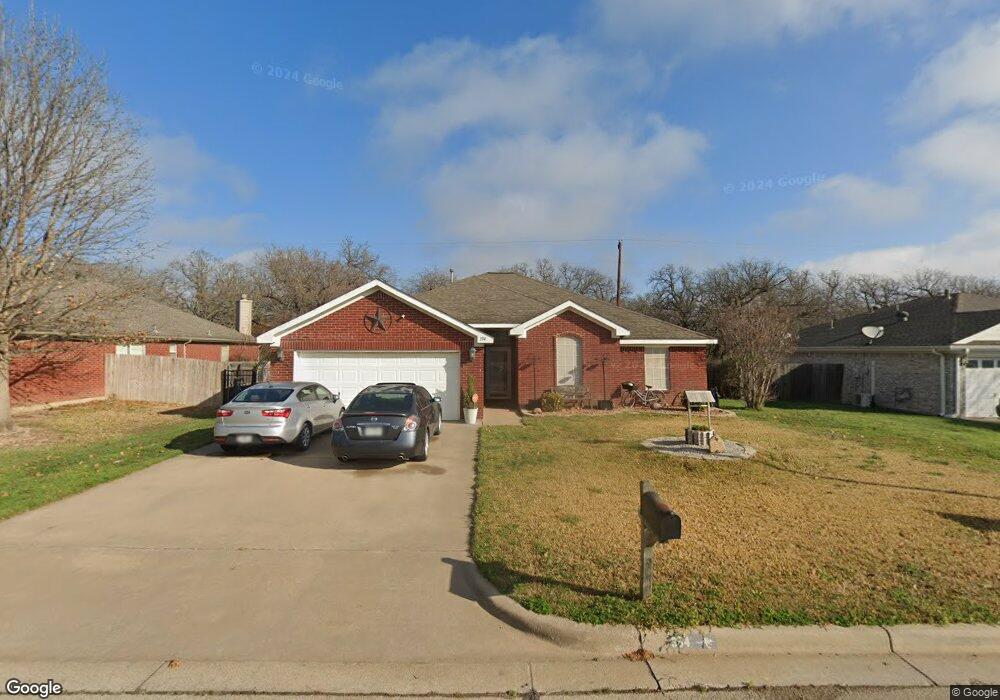
354 Dalhart Dr Weatherford, TX 76086
Estimated Value: $292,000 - $339,000
3
Beds
2
Baths
1,772
Sq Ft
$179/Sq Ft
Est. Value
About This Home
This home is located at 354 Dalhart Dr, Weatherford, TX 76086 and is currently estimated at $317,580, approximately $179 per square foot. 354 Dalhart Dr is a home located in Parker County with nearby schools including Crockett Elementary School, Tison Middle School, and Weatherford High School.
Ownership History
Date
Name
Owned For
Owner Type
Purchase Details
Closed on
May 23, 2023
Sold by
Cronin Joe
Bought by
Cronin Robert Wayne and Cronin Tina Marie
Current Estimated Value
Purchase Details
Closed on
Oct 3, 2017
Sold by
Torpy Arthur A and Torpy Susan Wood
Bought by
Cronin Joe
Purchase Details
Closed on
Jun 25, 2009
Sold by
Lacaze Michael G and Lacaze Jennifer L
Bought by
Torpy Arthur A and Torpy Susan Wood
Home Financials for this Owner
Home Financials are based on the most recent Mortgage that was taken out on this home.
Original Mortgage
$104,000
Interest Rate
4.84%
Mortgage Type
Purchase Money Mortgage
Purchase Details
Closed on
Jul 27, 2000
Sold by
Choice Homes Inc
Bought by
Torpy Arthur A and Torpy Susan
Purchase Details
Closed on
May 16, 2000
Sold by
Sweetwater Land & Cattle Co Lt
Bought by
Torpy Arthur A and Torpy Susan
Create a Home Valuation Report for This Property
The Home Valuation Report is an in-depth analysis detailing your home's value as well as a comparison with similar homes in the area
Home Values in the Area
Average Home Value in this Area
Purchase History
| Date | Buyer | Sale Price | Title Company |
|---|---|---|---|
| Cronin Robert Wayne | -- | None Listed On Document | |
| Cronin Joe | -- | Providence Title Company | |
| Torpy Arthur A | -- | Fnt | |
| Torpy Arthur A | -- | -- | |
| Torpy Arthur A | -- | -- |
Source: Public Records
Mortgage History
| Date | Status | Borrower | Loan Amount |
|---|---|---|---|
| Previous Owner | Torpy Arthur A | $104,000 |
Source: Public Records
Tax History Compared to Growth
Tax History
| Year | Tax Paid | Tax Assessment Tax Assessment Total Assessment is a certain percentage of the fair market value that is determined by local assessors to be the total taxable value of land and additions on the property. | Land | Improvement |
|---|---|---|---|---|
| 2025 | $6,598 | $320,440 | $50,000 | $270,440 |
| 2024 | $6,598 | $342,290 | $40,000 | $302,290 |
| 2023 | $6,598 | $342,290 | $40,000 | $302,290 |
| 2022 | $4,918 | $221,700 | $20,000 | $201,700 |
| 2021 | $5,324 | $221,700 | $20,000 | $201,700 |
| 2020 | $4,664 | $193,040 | $20,000 | $173,040 |
| 2019 | $4,930 | $193,040 | $20,000 | $173,040 |
| 2018 | $4,107 | $160,100 | $20,000 | $140,100 |
| 2017 | $3,987 | $160,100 | $20,000 | $140,100 |
| 2016 | $3,625 | $137,760 | $20,000 | $117,760 |
| 2015 | $3,069 | $137,760 | $20,000 | $117,760 |
| 2014 | $2,837 | $121,310 | $20,000 | $101,310 |
Source: Public Records
Map
Nearby Homes
- 1609 Dicey Rd
- 522 Crow Ave
- 509 Sweetwater Dr
- Horseshoe Bend Rd
- 0 Adell Cir
- 110 Pine St
- 249 Wandering Ln
- 214 Cedar St
- 309 De la Cruz St
- 101 Meadow Ct
- 107 Hickory Ln
- 313 De la Cruz St
- The Chisholm Plan at Hickory Place Addition
- 305 Hickory Ln
- 228 Allen St
- 1917 Windowmere Trail
- 307 Hickory Ln
- 905 Terry Trail
- 2113-A Dicey Rd
- Lot 14 Clover Cir