354 Irwins Place Chromo, CO 81128
Estimated Value: $706,000 - $952,000
2
Beds
1
Bath
1,864
Sq Ft
$436/Sq Ft
Est. Value
About This Home
This home is located at 354 Irwins Place, Chromo, CO 81128 and is currently estimated at $812,698, approximately $435 per square foot. 354 Irwins Place is a home with nearby schools including Pagosa Springs Elementary School, Pagosa Springs Middle School, and Pagosa Springs High School.
Ownership History
Date
Name
Owned For
Owner Type
Purchase Details
Closed on
Oct 11, 2023
Sold by
Sharon E Brown Revocable Trust and Brown Sharon E
Bought by
Wyndham Vacation Resorts Inc
Current Estimated Value
Purchase Details
Closed on
Mar 1, 2010
Sold by
Daphne Henderson Revocable Living Trust
Bought by
Byers Roger and Byers Susan
Purchase Details
Closed on
Mar 19, 2003
Sold by
Bi-State Financial Services
Bought by
Crowley Ranch Reserve Owners Association
Purchase Details
Closed on
Mar 8, 2002
Sold by
Henderson Daphne
Bought by
Henderson Daphne Trustee
Purchase Details
Closed on
Jun 8, 2000
Sold by
Robinson Keith E and Robinson Deborah S
Bought by
Henderson Daphne
Purchase Details
Closed on
Oct 20, 1995
Sold by
Bi-State Financial Services
Bought by
Robinson Keith E and Robinson Deborah S
Purchase Details
Closed on
Jul 30, 1993
Bought by
Bi-State Financial Services
Create a Home Valuation Report for This Property
The Home Valuation Report is an in-depth analysis detailing your home's value as well as a comparison with similar homes in the area
Home Values in the Area
Average Home Value in this Area
Purchase History
| Date | Buyer | Sale Price | Title Company |
|---|---|---|---|
| Wyndham Vacation Resorts Inc | $10,000 | None Listed On Document | |
| Byers Roger | $250,000 | None Available | |
| Crowley Ranch Reserve Owners Association | -- | -- | |
| Henderson Daphne Trustee | -- | -- | |
| Henderson Daphne | $262,000 | -- | |
| Robinson Keith E | $35,000 | -- | |
| Bi-State Financial Services | -- | -- |
Source: Public Records
Tax History Compared to Growth
Tax History
| Year | Tax Paid | Tax Assessment Tax Assessment Total Assessment is a certain percentage of the fair market value that is determined by local assessors to be the total taxable value of land and additions on the property. | Land | Improvement |
|---|---|---|---|---|
| 2024 | $2,189 | $38,920 | $3,560 | $35,360 |
| 2023 | $2,189 | $38,920 | $3,560 | $35,360 |
| 2022 | $1,614 | $27,270 | $2,920 | $24,350 |
| 2021 | $1,613 | $28,050 | $3,000 | $25,050 |
| 2020 | $1,274 | $22,160 | $3,000 | $19,160 |
| 2019 | $1,256 | $22,160 | $3,000 | $19,160 |
| 2018 | $1,494 | $24,230 | $4,900 | $19,330 |
| 2017 | $1,268 | $24,230 | $4,900 | $19,330 |
| 2016 | $1,047 | $19,840 | $5,410 | $14,430 |
| 2015 | -- | $19,840 | $5,410 | $14,430 |
| 2014 | -- | $20,600 | $8,720 | $11,880 |
Source: Public Records
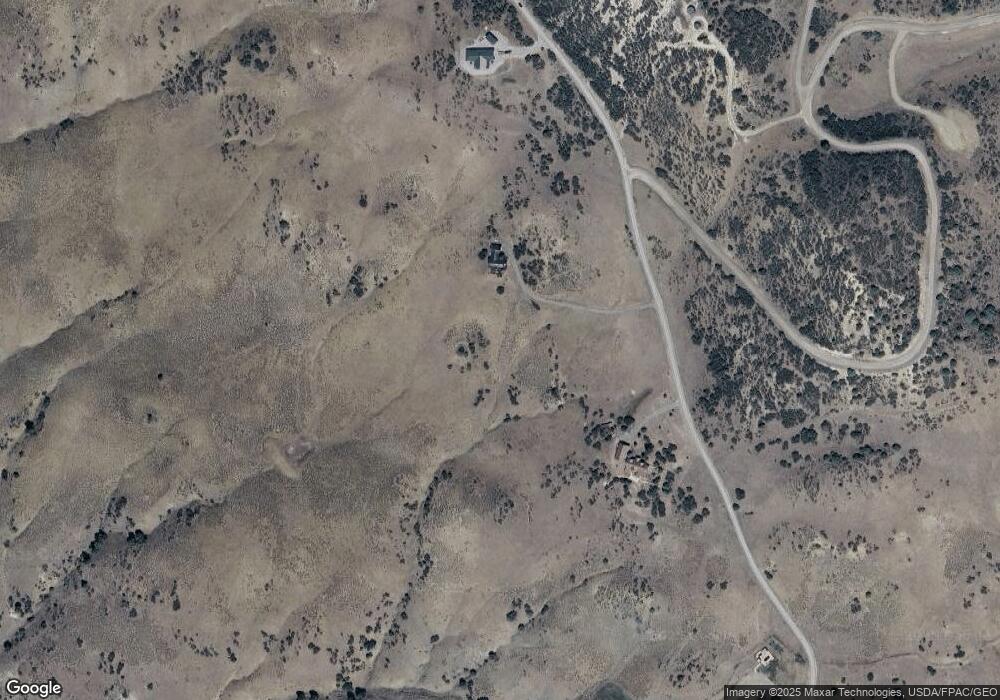
Map
Nearby Homes
- 645 Irwin Place
- 778 W Arbol Park Dr
- 1174 W Arbol Park Dr
- 1288 Crowley Dr
- 1240 Crowley Dr
- 1172 Crowley Dr
- 1084 Crowley Dr
- 362 Mary's Ct
- 558 Henry's Lake Dr
- 646 Henry's Lake Dr Unit C-23
- 133 W Arbol Park Dr
- 446 Henry's Lake Dr
- 767 Henry's Lake Dr
- 141 Spring Creek Cir
- 223 Spring Valley Ranch Rd
- 265 Spring Creek Cir
- 521 Spring Creek Cir
- 1231 Henry's Lake Dr
- 311 E Arbol Park Dr
- 457 E Arbol Park Dr
- 382 Irwin's Place
- 0 Irwin's Place Unit 736346
- 0 Irwin's Place Unit 671642
- 0 Irwin's Place Unit 719097
- 186 Irwin Place
- 640 Irwins Place
- 0 Irwin's Place Unit 755600
- 0 Irwin's Place Unit 656421
- 0 Irwin's Place Unit 670263
- 626 Arbol Park Dr
- 382 Irwin Place
- 186 Irwins
- 0 Irwins Place Unit 606917
- 0 Irwins Place Unit 663727
- 0 Irwins Place Unit 665430
- 0 Irwins Place Unit 625195
- 0 Irwins Place Unit 670764
- 0 Irwins Place Unit 679538
- 0 Irwins Place Unit 682846
- 0 Irwins Place Unit 687174