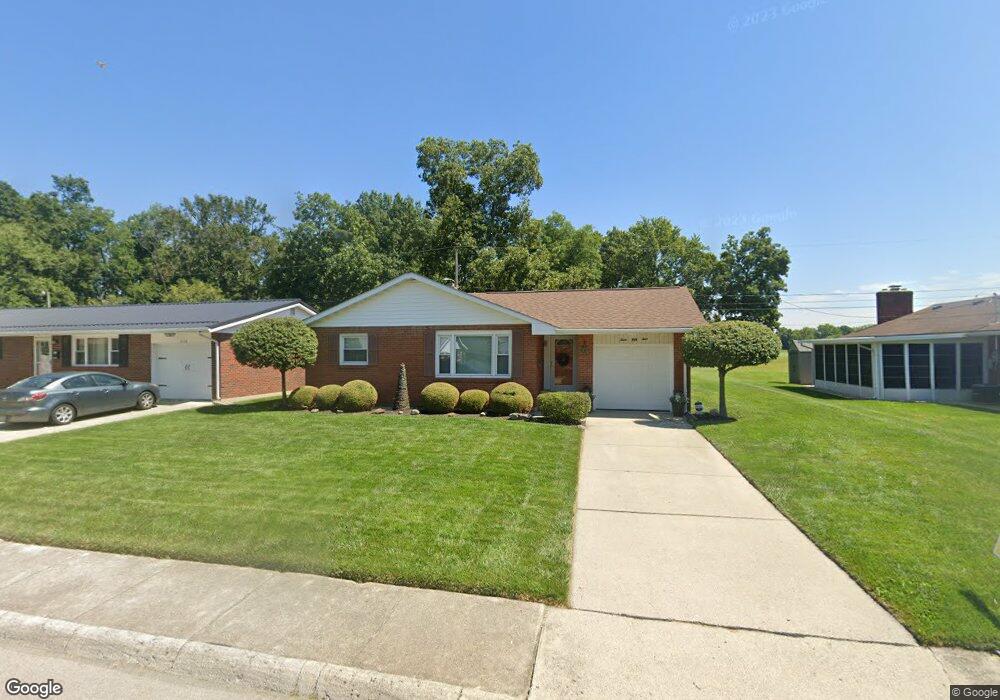
354 Kenyon Dr Wilmington, OH 45177
Estimated Value: $177,394 - $230,000
3
Beds
2
Baths
1,134
Sq Ft
$188/Sq Ft
Est. Value
About This Home
This home is located at 354 Kenyon Dr, Wilmington, OH 45177 and is currently estimated at $212,849, approximately $187 per square foot. 354 Kenyon Dr is a home located in Clinton County with nearby schools including East End Elementary School, Denver Place Elementary School, and Roy E. Holmes Elementary School.
Ownership History
Date
Name
Owned For
Owner Type
Purchase Details
Closed on
Mar 6, 2006
Sold by
Newkirk Mark R and Newkirk Pamela J
Bought by
Newkirk Mark R and Newkirk Pamela J
Current Estimated Value
Purchase Details
Closed on
Mar 3, 2006
Sold by
Newkirk Mark R and Newkirk Pamela J
Bought by
Newkirk Mark R and Newkirk Pamela J
Purchase Details
Closed on
Jun 3, 2004
Sold by
Newkirk Paul G and Newkirk Shirley
Bought by
Newkirk Mark R and Newkirk Pamela J
Home Financials for this Owner
Home Financials are based on the most recent Mortgage that was taken out on this home.
Original Mortgage
$76,650
Outstanding Balance
$37,444
Interest Rate
5.99%
Mortgage Type
Purchase Money Mortgage
Estimated Equity
$175,405
Purchase Details
Closed on
May 26, 2004
Sold by
Newkirk Paul G and Newkirk Shirleyj
Bought by
Newkirk Mark R and Newkirk Pamela J
Home Financials for this Owner
Home Financials are based on the most recent Mortgage that was taken out on this home.
Original Mortgage
$76,650
Outstanding Balance
$37,444
Interest Rate
5.99%
Mortgage Type
Purchase Money Mortgage
Estimated Equity
$175,405
Purchase Details
Closed on
Jan 1, 1990
Bought by
Newkirk Paul G and Newkirk Shirley
Create a Home Valuation Report for This Property
The Home Valuation Report is an in-depth analysis detailing your home's value as well as a comparison with similar homes in the area
Home Values in the Area
Average Home Value in this Area
Purchase History
| Date | Buyer | Sale Price | Title Company |
|---|---|---|---|
| Newkirk Mark R | -- | -- | |
| Newkirk Mark R | -- | None Available | |
| Newkirk Mark R | $97,000 | -- | |
| Newkirk Mark R | $97,000 | -- | |
| Newkirk Paul G | -- | -- |
Source: Public Records
Mortgage History
| Date | Status | Borrower | Loan Amount |
|---|---|---|---|
| Open | Newkirk Mark R | $76,650 |
Source: Public Records
Tax History Compared to Growth
Tax History
| Year | Tax Paid | Tax Assessment Tax Assessment Total Assessment is a certain percentage of the fair market value that is determined by local assessors to be the total taxable value of land and additions on the property. | Land | Improvement |
|---|---|---|---|---|
| 2024 | $1,326 | $39,480 | $7,490 | $31,990 |
| 2023 | $1,326 | $39,480 | $7,490 | $31,990 |
| 2022 | $1,103 | $30,920 | $6,840 | $24,080 |
| 2021 | $1,116 | $30,920 | $6,840 | $24,080 |
| 2020 | $1,049 | $30,920 | $6,840 | $24,080 |
| 2019 | $989 | $26,610 | $5,990 | $20,620 |
| 2018 | $998 | $26,610 | $5,990 | $20,620 |
| 2017 | $970 | $26,610 | $5,990 | $20,620 |
| 2016 | $1,001 | $27,130 | $5,920 | $21,210 |
| 2015 | $985 | $27,130 | $5,920 | $21,210 |
| 2013 | $973 | $26,500 | $5,920 | $20,580 |
Source: Public Records
Map
Nearby Homes
- 1244 Mayfair Dr
- 585 Silverado Dr
- 909 W Main St
- 423 Howard St
- 373 Thorne Ave
- 12 Peterson Place
- 584 Howard St
- 360 Summit St
- 629 Oakridge Dr
- 1624 Lakewood Dr
- 555 Cross Creek Dr
- 62 Gallup St
- 146 N Spring St
- 987 N Nelson Ave
- 136 N Spring St
- 149 W Truesdell St
- 0 S US Rt 68 Unit 1527315
- 157 Indiana Ave
- 0 St Rt 134 Unit 1607133
- 31 Fairland Ave