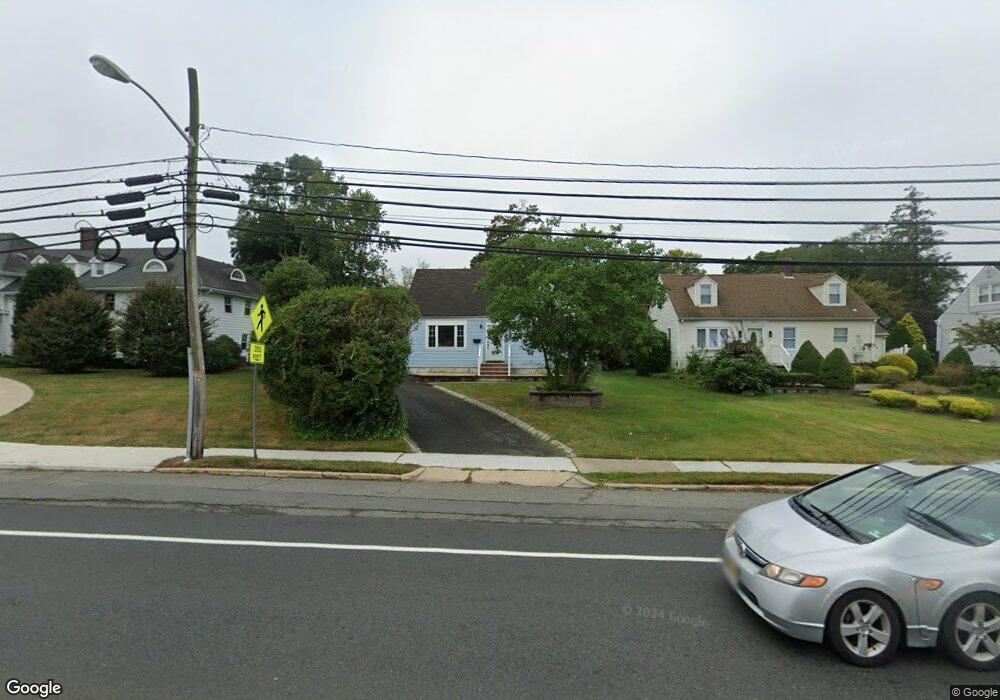
354 Main St Matawan, NJ 07747
Estimated Value: $517,000 - $582,000
3
Beds
2
Baths
1,359
Sq Ft
$403/Sq Ft
Est. Value
About This Home
This home is located at 354 Main St, Matawan, NJ 07747 and is currently estimated at $547,981, approximately $403 per square foot. 354 Main St is a home located in Monmouth County with nearby schools including Matawan Reg High School, Matawan Montessori Academy, and St. Joseph Elementary School.
Ownership History
Date
Name
Owned For
Owner Type
Purchase Details
Closed on
Sep 25, 2021
Sold by
Florindo Rosa L and Florindo Janette
Bought by
Florindo Rosa L
Current Estimated Value
Home Financials for this Owner
Home Financials are based on the most recent Mortgage that was taken out on this home.
Original Mortgage
$305,000
Outstanding Balance
$278,132
Interest Rate
2.8%
Mortgage Type
New Conventional
Estimated Equity
$269,849
Purchase Details
Closed on
Mar 31, 2008
Sold by
Florindo Armando and Florindo Rosa
Bought by
Florindo Rosa L and Florindo Janett
Home Financials for this Owner
Home Financials are based on the most recent Mortgage that was taken out on this home.
Original Mortgage
$337,487
Interest Rate
6.3%
Mortgage Type
New Conventional
Purchase Details
Closed on
Oct 1, 2001
Sold by
Blasco Vincent
Bought by
Florindo Armando and Florindo Rosa
Home Financials for this Owner
Home Financials are based on the most recent Mortgage that was taken out on this home.
Original Mortgage
$176,130
Interest Rate
6.89%
Create a Home Valuation Report for This Property
The Home Valuation Report is an in-depth analysis detailing your home's value as well as a comparison with similar homes in the area
Home Values in the Area
Average Home Value in this Area
Purchase History
| Date | Buyer | Sale Price | Title Company |
|---|---|---|---|
| Florindo Rosa L | -- | None Available | |
| Florindo Rosa L | -- | Commonwealth | |
| Florindo Armando | $185,400 | -- |
Source: Public Records
Mortgage History
| Date | Status | Borrower | Loan Amount |
|---|---|---|---|
| Open | Florindo Rosa L | $305,000 | |
| Closed | Florindo Rosa L | $337,487 | |
| Closed | Florindo Armando | $176,130 |
Source: Public Records
Tax History Compared to Growth
Tax History
| Year | Tax Paid | Tax Assessment Tax Assessment Total Assessment is a certain percentage of the fair market value that is determined by local assessors to be the total taxable value of land and additions on the property. | Land | Improvement |
|---|---|---|---|---|
| 2025 | $9,441 | $458,400 | $265,600 | $192,800 |
| 2024 | $9,172 | $432,500 | $279,100 | $153,400 |
| 2023 | $9,172 | $421,900 | $270,100 | $151,800 |
| 2022 | $8,203 | $344,500 | $199,900 | $144,600 |
| 2021 | $6,094 | $301,900 | $170,200 | $131,700 |
| 2020 | $7,970 | $291,300 | $161,200 | $130,100 |
| 2019 | $7,767 | $284,500 | $157,600 | $126,900 |
| 2018 | $7,726 | $278,400 | $153,100 | $125,300 |
| 2017 | $7,516 | $267,000 | $144,100 | $122,900 |
| 2016 | $7,190 | $260,900 | $139,600 | $121,300 |
| 2015 | $6,635 | $242,600 | $126,100 | $116,500 |
| 2014 | $6,597 | $242,100 | $121,600 | $120,500 |
Source: Public Records
Map
Nearby Homes
- 8 Sutphin Ave
- 3 Sutphin Ave
- 14 New Brunswick Ave
- 320 Main St
- 284 Broad St
- 326 Sloan Ct Unit 326
- 37 New Brunswick Ave
- 7 Sunset Ave
- 532 Sloan Ct Unit 532
- 258 Jackson St
- 119 Freneau Ave
- 160 Freneau Ave
- 10 Somerset Place
- 12 S Atlantic Ave Unit 14
- 537 S Atlantic Ave
- 10 7th St
- 3 Magnolia Ct
- 5 7th St
- 111 Courtland Ln
- 32 Lake Blvd