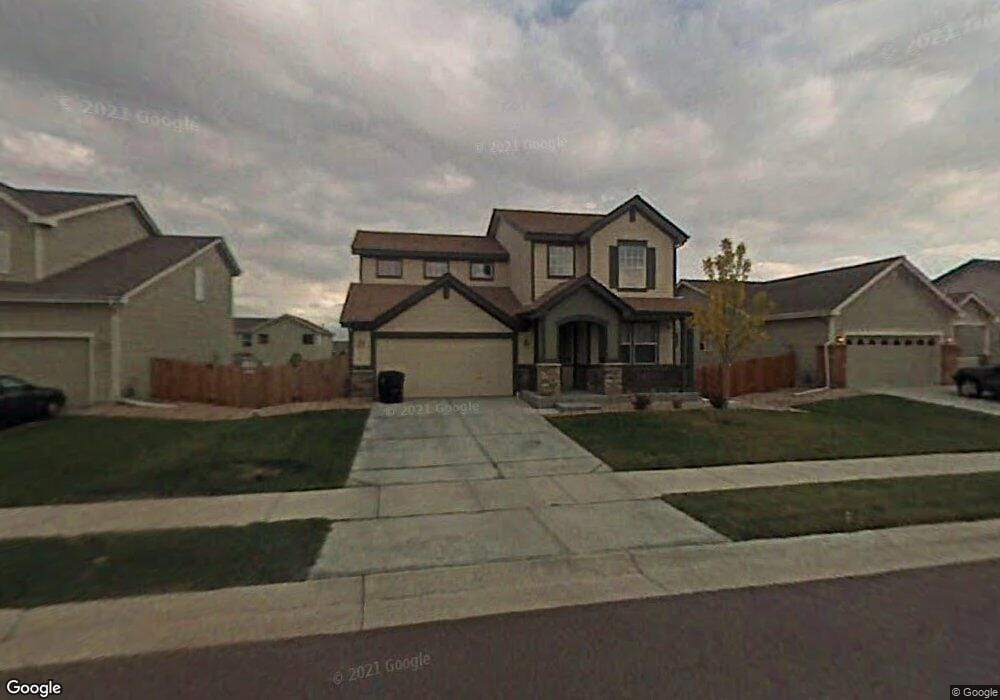
354 Mt. Sherman St Brighton, CO 80601
Estimated Value: $491,195 - $519,000
3
Beds
3
Baths
2,485
Sq Ft
$205/Sq Ft
Est. Value
About This Home
This home is located at 354 Mt. Sherman St, Brighton, CO 80601 and is currently estimated at $509,299, approximately $204 per square foot. 354 Mt. Sherman St is a home located in Adams County with nearby schools including Pennock Elementary School, Overland Trail Middle School, and Brighton High School.
Ownership History
Date
Name
Owned For
Owner Type
Purchase Details
Closed on
Sep 6, 2019
Sold by
Romero John J and Romero Ashley C
Bought by
Romero John J
Current Estimated Value
Purchase Details
Closed on
Nov 10, 2016
Sold by
Otis Ben M and Otis Abbie B
Bought by
Romero John J and Romero Ashley C
Home Financials for this Owner
Home Financials are based on the most recent Mortgage that was taken out on this home.
Original Mortgage
$324,022
Outstanding Balance
$256,435
Interest Rate
3.87%
Mortgage Type
FHA
Estimated Equity
$252,864
Purchase Details
Closed on
Dec 27, 2005
Sold by
Centex Homes
Bought by
Otis Ben M and Otis Abbie B
Home Financials for this Owner
Home Financials are based on the most recent Mortgage that was taken out on this home.
Original Mortgage
$181,147
Interest Rate
6.23%
Mortgage Type
Fannie Mae Freddie Mac
Create a Home Valuation Report for This Property
The Home Valuation Report is an in-depth analysis detailing your home's value as well as a comparison with similar homes in the area
Home Values in the Area
Average Home Value in this Area
Purchase History
| Date | Buyer | Sale Price | Title Company |
|---|---|---|---|
| Romero John J | -- | None Available | |
| Romero John J | $330,000 | First American Title | |
| Otis Ben M | $226,434 | Commerce Title |
Source: Public Records
Mortgage History
| Date | Status | Borrower | Loan Amount |
|---|---|---|---|
| Open | Romero John J | $324,022 | |
| Previous Owner | Otis Ben M | $181,147 |
Source: Public Records
Tax History Compared to Growth
Tax History
| Year | Tax Paid | Tax Assessment Tax Assessment Total Assessment is a certain percentage of the fair market value that is determined by local assessors to be the total taxable value of land and additions on the property. | Land | Improvement |
|---|---|---|---|---|
| 2024 | $5,806 | $31,000 | $6,560 | $24,440 |
| 2023 | $5,645 | $35,580 | $6,360 | $29,220 |
| 2022 | $4,352 | $25,120 | $6,530 | $18,590 |
| 2021 | $4,196 | $25,120 | $6,530 | $18,590 |
| 2020 | $4,303 | $25,070 | $6,720 | $18,350 |
| 2019 | $4,030 | $25,070 | $6,720 | $18,350 |
| 2018 | $3,562 | $22,120 | $3,460 | $18,660 |
| 2017 | $3,565 | $22,120 | $3,460 | $18,660 |
| 2016 | $2,846 | $18,240 | $3,820 | $14,420 |
| 2015 | $2,834 | $18,240 | $3,820 | $14,420 |
| 2014 | $2,177 | $14,120 | $3,260 | $10,860 |
Source: Public Records
Map
Nearby Homes
- 4749 Mount Shavano St
- 4824 Mt Shavano St
- 4670 Quandary Peak St
- 4950 Mount Cameron Dr
- 4641 Quandary Peak St
- 4589 Quandary Peak St
- 4454 Mount Lincoln St
- 4591 Crestone Peak St
- 4445 Tanner Peak Trail
- 4314 Mount Oxford St
- 19 S 45th Ave
- 5113 Grey Swallow St
- 376 Lake Granby Ave
- 336 Lake Granby Ave
- 316 Lake Granby Ave
- 306 Lake Granby Ave
- HOLCOMBE Plan at Brighton Crossings - Brighton Crossing
- CHATHAM Plan at Brighton Crossings - Brighton Crossing
- GABLE Plan at Brighton Crossings - Brighton Crossing
- NEWCASTLE Plan at Brighton Crossings - Brighton Crossing
- 334 Mt. Sherman St
- 374 Mt. Sherman St
- 374 Mount Sherman St
- 353 Mt. Lindsey St
- 324 Mt. Sherman St
- 384 Mt. Sherman St
- 353 Mt Lindsey St
- 384 Mt Sherman St
- 333 Mt. Lindsey St
- 373 Mt. Lindsey St
- 384 Mount Sherman St
- 373 Mt Lindsey St
- 355 Mt. Sherman St
- 375 Mount Sherman St
- 335 Mt. Sherman St
- 375 Mt. Sherman St
- 323 Mt. Lindsey St
- 383 Mt. Lindsey St
- 323 Mount Lindsey St
- 325 Mt Sherman St