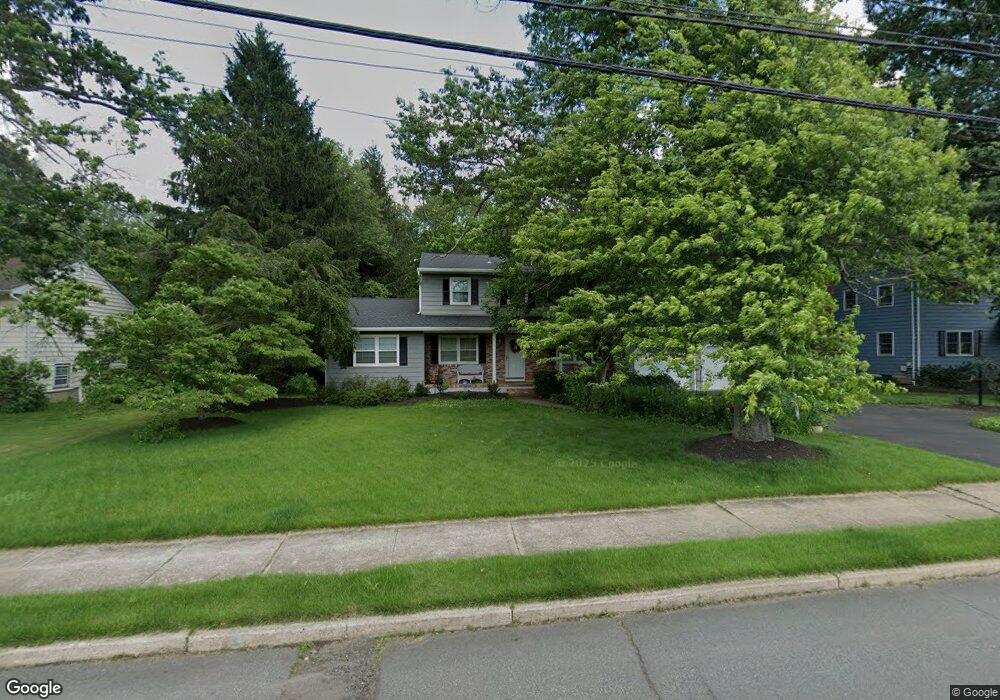
354 N Post Rd Princeton Junction, NJ 08550
Estimated Value: $866,391 - $1,024,000
4
Beds
3
Baths
2,032
Sq Ft
$458/Sq Ft
Est. Value
About This Home
This home is located at 354 N Post Rd, Princeton Junction, NJ 08550 and is currently estimated at $929,848, approximately $457 per square foot. 354 N Post Rd is a home located in Mercer County with nearby schools including Maurice Hawk Elementary School, Village Elementary School, and Thomas R. Grover Middle School.
Ownership History
Date
Name
Owned For
Owner Type
Purchase Details
Closed on
Apr 8, 2009
Sold by
Aprea William L and Aprea Kathleen K
Bought by
Ruiz Rafael E and Levis Ruiz Livia E
Current Estimated Value
Home Financials for this Owner
Home Financials are based on the most recent Mortgage that was taken out on this home.
Original Mortgage
$392,000
Outstanding Balance
$247,807
Interest Rate
4.94%
Mortgage Type
Purchase Money Mortgage
Estimated Equity
$682,041
Purchase Details
Closed on
Dec 27, 2005
Sold by
Carignan John
Bought by
Aprea William and Aprea Kathleen
Purchase Details
Closed on
Jan 19, 2001
Sold by
Alaska Seaboard
Bought by
Carignan John and Carignan Leslie
Home Financials for this Owner
Home Financials are based on the most recent Mortgage that was taken out on this home.
Original Mortgage
$225,840
Interest Rate
7.13%
Mortgage Type
Purchase Money Mortgage
Create a Home Valuation Report for This Property
The Home Valuation Report is an in-depth analysis detailing your home's value as well as a comparison with similar homes in the area
Home Values in the Area
Average Home Value in this Area
Purchase History
| Date | Buyer | Sale Price | Title Company |
|---|---|---|---|
| Ruiz Rafael E | $490,000 | Fidelity Natl Title Ins Co | |
| Aprea William | $480,000 | -- | |
| Carignan John | $282,300 | -- |
Source: Public Records
Mortgage History
| Date | Status | Borrower | Loan Amount |
|---|---|---|---|
| Open | Ruiz Rafael E | $392,000 | |
| Previous Owner | Carignan John | $225,840 |
Source: Public Records
Tax History Compared to Growth
Tax History
| Year | Tax Paid | Tax Assessment Tax Assessment Total Assessment is a certain percentage of the fair market value that is determined by local assessors to be the total taxable value of land and additions on the property. | Land | Improvement |
|---|---|---|---|---|
| 2025 | $14,712 | $480,000 | $207,800 | $272,200 |
| 2024 | $14,098 | $480,000 | $207,800 | $272,200 |
| 2023 | $14,098 | $480,000 | $207,800 | $272,200 |
| 2022 | $13,824 | $480,000 | $207,800 | $272,200 |
| 2021 | $13,709 | $480,000 | $207,800 | $272,200 |
| 2020 | $13,459 | $480,000 | $207,800 | $272,200 |
| 2019 | $13,306 | $480,000 | $207,800 | $272,200 |
| 2018 | $13,181 | $480,000 | $207,800 | $272,200 |
| 2017 | $12,907 | $480,000 | $207,800 | $272,200 |
| 2016 | $12,629 | $480,000 | $207,800 | $272,200 |
| 2015 | $12,336 | $480,000 | $207,800 | $272,200 |
| 2014 | $12,192 | $480,000 | $207,800 | $272,200 |
Source: Public Records
Map
Nearby Homes
- 298 N Post Rd
- 1 Hawk Dr
- 10 Norbridge Dr
- 3 Yorktowne Ct
- 9 Wedgewood Ct
- 24 Hereford Dr
- 40 Caleb Ln
- 951 Alexander Rd
- 43 Wallace Rd
- 53 E Shrewsbury Place
- 103 Harris Rd
- 90 Bear Brook Rd
- 2 Corio Ct
- 1 Corio Ct
- 90 Princeton Hightstown Rd
- 8 Corio Ct
- 5 Corio Ct
- 10 Corio Ct
- 3103 Justin Dr
- 1005 Justin Dr Unit 1002