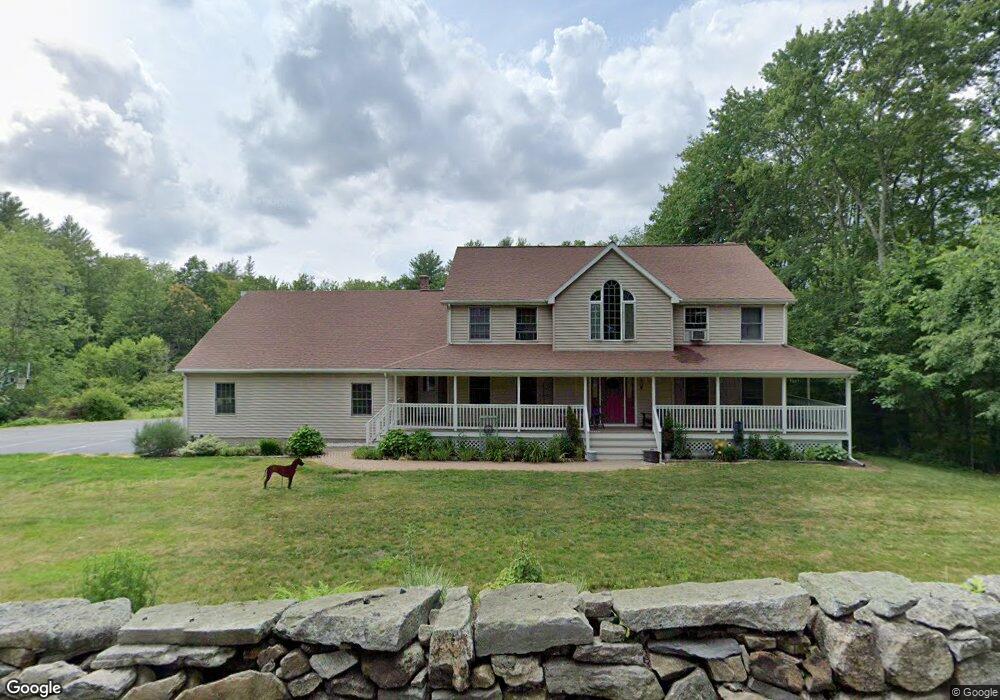
354 South St Auburn, MA 01501
Pondville NeighborhoodEstimated Value: $772,348 - $841,000
3
Beds
3
Baths
2,686
Sq Ft
$297/Sq Ft
Est. Value
About This Home
This home is located at 354 South St, Auburn, MA 01501 and is currently estimated at $798,837, approximately $297 per square foot. 354 South St is a home located in Worcester County with nearby schools including Auburn Senior High School and Shrewsbury Montessori School - Auburn Campus.
Ownership History
Date
Name
Owned For
Owner Type
Purchase Details
Closed on
Nov 2, 1998
Sold by
Mayer Peter G and Mayer Francies M
Bought by
Picard David P and Picard Elizabeth
Current Estimated Value
Purchase Details
Closed on
Feb 9, 1996
Sold by
Avery Shanna A and Shackelford Donna
Bought by
Mayer Peter G and Mayer Frances
Purchase Details
Closed on
Dec 15, 1989
Sold by
Jafari Hamid
Bought by
Giovanetti Matthew
Create a Home Valuation Report for This Property
The Home Valuation Report is an in-depth analysis detailing your home's value as well as a comparison with similar homes in the area
Home Values in the Area
Average Home Value in this Area
Purchase History
| Date | Buyer | Sale Price | Title Company |
|---|---|---|---|
| Picard David P | $290,000 | -- | |
| Mayer Peter G | $20,000 | -- | |
| Giovanetti Matthew | $180,000 | -- |
Source: Public Records
Mortgage History
| Date | Status | Borrower | Loan Amount |
|---|---|---|---|
| Open | Giovanetti Matthew | $48,900 | |
| Open | Giovanetti Matthew | $423,100 |
Source: Public Records
Tax History Compared to Growth
Tax History
| Year | Tax Paid | Tax Assessment Tax Assessment Total Assessment is a certain percentage of the fair market value that is determined by local assessors to be the total taxable value of land and additions on the property. | Land | Improvement |
|---|---|---|---|---|
| 2025 | $98 | $687,700 | $131,500 | $556,200 |
| 2024 | $10,473 | $701,500 | $127,900 | $573,600 |
| 2023 | $9,984 | $628,700 | $116,400 | $512,300 |
| 2022 | $9,091 | $540,500 | $116,400 | $424,100 |
| 2021 | $9,094 | $501,300 | $102,600 | $398,700 |
| 2020 | $9,008 | $501,000 | $102,600 | $398,400 |
| 2019 | $3,097 | $477,900 | $101,400 | $376,500 |
| 2018 | $9,374 | $473,800 | $94,800 | $379,000 |
| 2017 | $2,926 | $465,400 | $86,400 | $379,000 |
| 2016 | $8,646 | $460,500 | $88,800 | $371,700 |
| 2015 | $7,905 | $458,000 | $88,800 | $369,200 |
| 2014 | $7,774 | $449,600 | $84,600 | $365,000 |
Source: Public Records
Map
Nearby Homes