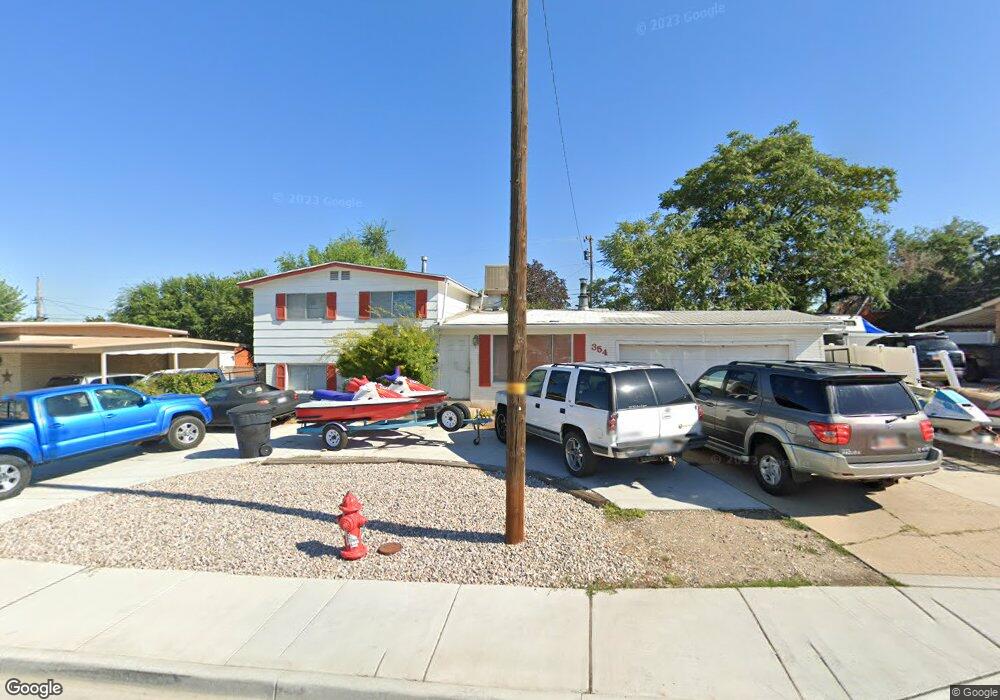
354 W 800 N Clearfield, UT 84015
Estimated Value: $373,000 - $392,000
4
Beds
2
Baths
1,545
Sq Ft
$246/Sq Ft
Est. Value
About This Home
This home is located at 354 W 800 N, Clearfield, UT 84015 and is currently estimated at $379,834, approximately $245 per square foot. 354 W 800 N is a home located in Davis County with nearby schools including Doxey Elementary School, Sunset Junior High School, and Northridge High School.
Ownership History
Date
Name
Owned For
Owner Type
Purchase Details
Closed on
Feb 2, 2009
Sold by
Ferguson Bill and Ferguson Tina Marie
Bought by
Ferguson Bill
Current Estimated Value
Home Financials for this Owner
Home Financials are based on the most recent Mortgage that was taken out on this home.
Original Mortgage
$119,150
Outstanding Balance
$74,748
Interest Rate
5.04%
Mortgage Type
New Conventional
Estimated Equity
$305,086
Purchase Details
Closed on
Feb 23, 2006
Sold by
Ferguson Bill
Bought by
Ferguson Bill and Ferguson Tina Marie
Home Financials for this Owner
Home Financials are based on the most recent Mortgage that was taken out on this home.
Original Mortgage
$108,000
Interest Rate
7.87%
Mortgage Type
Fannie Mae Freddie Mac
Purchase Details
Closed on
Nov 12, 1998
Sold by
Luinetti William K and Luinetti Marie P
Bought by
Ferguson Bill
Create a Home Valuation Report for This Property
The Home Valuation Report is an in-depth analysis detailing your home's value as well as a comparison with similar homes in the area
Home Values in the Area
Average Home Value in this Area
Purchase History
| Date | Buyer | Sale Price | Title Company |
|---|---|---|---|
| Ferguson Bill | -- | Utah Commercial Title Co | |
| Ferguson Bill | -- | Inwest Title Services Inc | |
| Ferguson Bill | -- | Backman Stewart Title Servic |
Source: Public Records
Mortgage History
| Date | Status | Borrower | Loan Amount |
|---|---|---|---|
| Open | Ferguson Bill | $119,150 | |
| Closed | Ferguson Bill | $108,000 |
Source: Public Records
Tax History
| Year | Tax Paid | Tax Assessment Tax Assessment Total Assessment is a certain percentage of the fair market value that is determined by local assessors to be the total taxable value of land and additions on the property. | Land | Improvement |
|---|---|---|---|---|
| 2025 | $2,032 | $185,350 | $61,953 | $123,397 |
| 2024 | $1,899 | $173,250 | $59,226 | $114,024 |
| 2023 | $1,768 | $294,000 | $94,730 | $199,270 |
| 2022 | $1,888 | $169,950 | $54,293 | $115,657 |
| 2021 | $1,618 | $229,000 | $57,854 | $171,146 |
| 2020 | $1,409 | $196,000 | $48,695 | $147,305 |
| 2019 | $1,331 | $190,000 | $62,915 | $127,085 |
| 2018 | $1,181 | $165,000 | $50,278 | $114,722 |
| 2016 | $1,018 | $73,095 | $23,769 | $49,326 |
| 2015 | $940 | $63,965 | $23,769 | $40,196 |
| 2014 | $895 | $62,229 | $23,935 | $38,294 |
| 2013 | -- | $64,697 | $23,265 | $41,432 |
Source: Public Records
Map
Nearby Homes
Your Personal Tour Guide
Ask me questions while you tour the home.