Estimated Value: $197,007 - $213,000
3
Beds
2
Baths
1,200
Sq Ft
$172/Sq Ft
Est. Value
About This Home
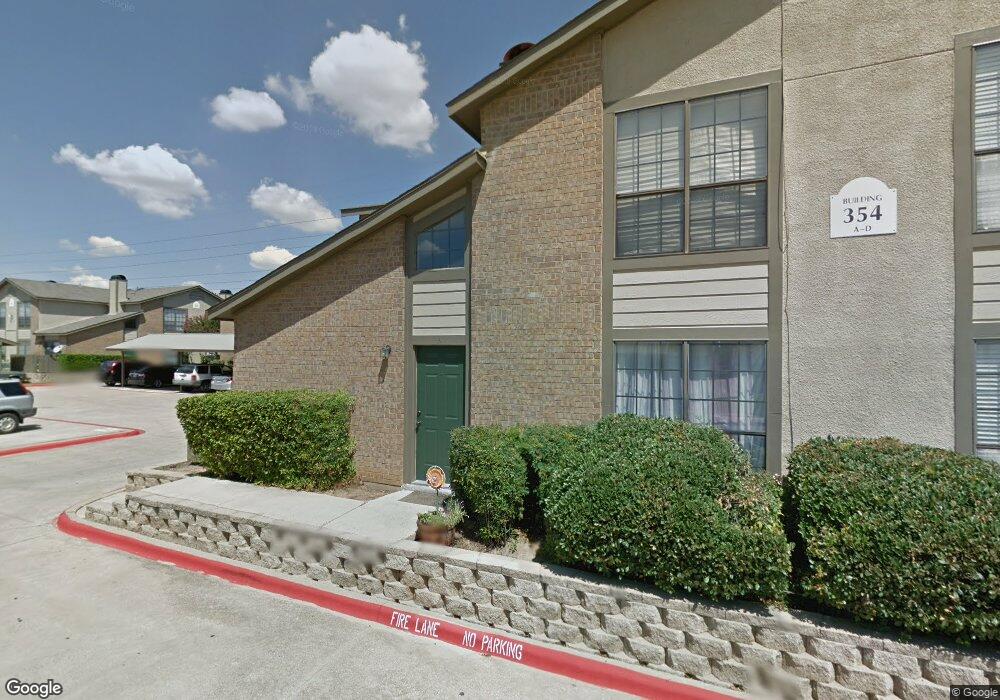
This home is located at 354 W Harwood Rd Unit C, Hurst, TX 76054 and is currently estimated at $206,002, approximately $171 per square foot. 354 W Harwood Rd Unit C is a home located in Tarrant County with nearby schools including Shady Oaks Elementary School, Bedford Junior High School, and L.D. Bell High School.
Ownership History
Date
Name
Owned For
Owner Type
Purchase Details
Closed on
Jun 15, 2015
Sold by
Marshall Fraser A and Marshall Brooks A
Bought by
Homeland Project Llc
Current Estimated Value
Purchase Details
Closed on
Jul 3, 2014
Sold by
Fannie Mae
Bought by
Marshall Fraser A and Marshall Brooks A
Purchase Details
Closed on
Feb 27, 2001
Sold by
Hailey Douglas A Bert and Hailey Christine L
Bought by
Kilgore Richard M and Kilgore Barbara L
Home Financials for this Owner
Home Financials are based on the most recent Mortgage that was taken out on this home.
Original Mortgage
$62,700
Interest Rate
6.97%
Mortgage Type
Purchase Money Mortgage
Purchase Details
Closed on
Nov 26, 1999
Sold by
Texas Acquisitions
Bought by
Kinnaird Imogene
Home Financials for this Owner
Home Financials are based on the most recent Mortgage that was taken out on this home.
Original Mortgage
$32,000
Interest Rate
7.93%
Mortgage Type
Purchase Money Mortgage
Create a Home Valuation Report for This Property
The Home Valuation Report is an in-depth analysis detailing your home's value as well as a comparison with similar homes in the area
Home Values in the Area
Average Home Value in this Area
Purchase History
| Date | Buyer | Sale Price | Title Company |
|---|---|---|---|
| Homeland Project Llc | -- | Old Republic Title | |
| Marshall Fraser A | -- | Braham Title & Escrow | |
| Kilgore Richard M | -- | -- | |
| Kinnaird Imogene | -- | Fidelity National Title |
Source: Public Records
Mortgage History
| Date | Status | Borrower | Loan Amount |
|---|---|---|---|
| Previous Owner | Kilgore Richard M | $62,700 | |
| Previous Owner | Kinnaird Imogene | $32,000 |
Source: Public Records
Tax History Compared to Growth
Tax History
| Year | Tax Paid | Tax Assessment Tax Assessment Total Assessment is a certain percentage of the fair market value that is determined by local assessors to be the total taxable value of land and additions on the property. | Land | Improvement |
|---|---|---|---|---|
| 2025 | $3,427 | $208,650 | $30,000 | $178,650 |
| 2024 | $3,427 | $208,650 | $30,000 | $178,650 |
| 2023 | $3,427 | $171,078 | $17,000 | $154,078 |
| 2022 | $3,672 | $159,489 | $17,000 | $142,489 |
| 2021 | $3,643 | $151,071 | $17,000 | $134,071 |
| 2020 | $3,510 | $145,906 | $17,000 | $128,906 |
| 2019 | $3,596 | $146,938 | $17,000 | $129,938 |
| 2018 | $2,746 | $112,197 | $17,000 | $95,197 |
| 2017 | $2,696 | $106,550 | $17,000 | $89,550 |
| 2016 | $2,388 | $94,357 | $17,000 | $77,357 |
| 2015 | $2,486 | $94,800 | $17,000 | $77,800 |
| 2014 | $2,486 | $94,800 | $17,000 | $77,800 |
Source: Public Records
Map
Nearby Homes
- 340 W Harwood Rd Unit D
- 421 Cavender Ct
- 2041 Parkridge Dr
- 2016 Briar Trail
- 2212 Mountainview Dr
- 600 Circleview Dr N
- 124 Jeannie Ct
- 2212 Hurstview Dr
- 233 Hillview Dr
- 1732 Jeannie Ln
- 432 Sunnybrook Ct
- 404 Heather Ln
- TBD Hurstview Dr
- 3011 Carolyn Ct
- 2244 Hurstview Dr
- 612 Circleview Dr S
- 200 Shady Lake Dr
- 332 Plainview Dr
- 229 Brookview Dr
- 521 Brookview Dr
- 354 W Harwood Rd Unit A
- 354 W Harwood Rd Unit B
- 354 W Harwood Rd Unit 179
- 358 W Harwood Rd Unit D
- 358 W Harwood Rd Unit C
- 358 W Harwood Rd Unit F
- 358 W Harwood Rd Unit E
- 358 W Harwood Rd Unit H
- 358 W Harwood Rd Unit G
- 358 W Harwood Rd Unit B
- 358 W Harwood Rd Unit A
- 358 W Harwood Rd Unit 174
- 356 W Harwood Rd Unit C
- 356 W Harwood Rd Unit B
- 356 W Harwood Rd Unit F
- 356 W Harwood Rd Unit H
- 356 W Harwood Rd Unit E
- 356 W Harwood Rd Unit D
- 356 W Harwood Rd Unit C
- 356 W Harwood Rd Unit A