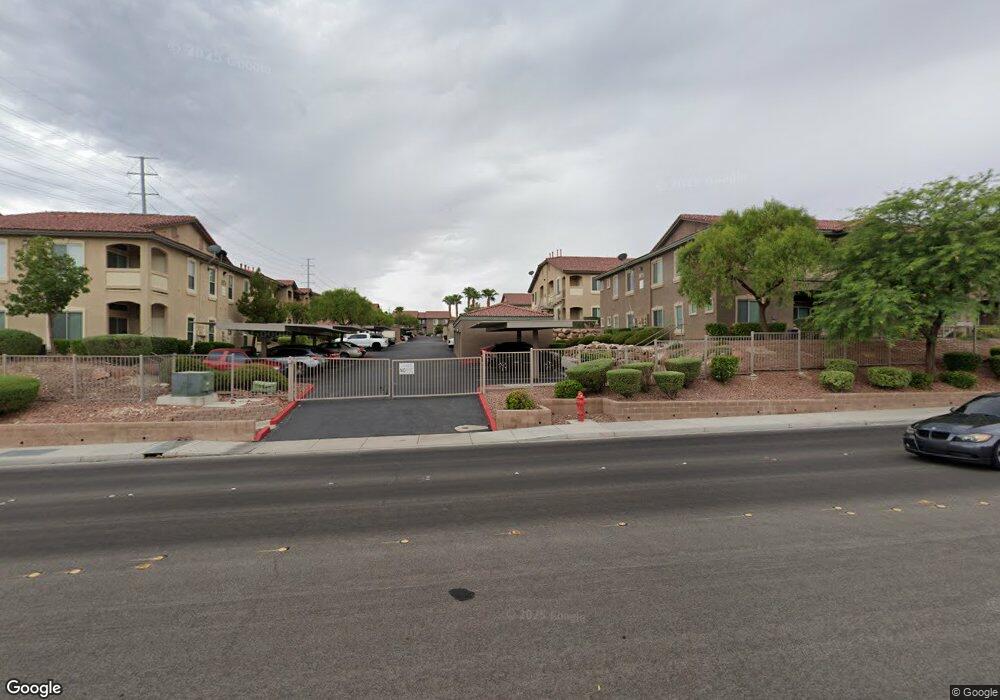
3541 Desert Cliff St Unit 104 Las Vegas, NV 89129
Lone Mountain NeighborhoodEstimated Value: $278,000 - $286,412
2
Beds
2
Baths
1,242
Sq Ft
$227/Sq Ft
Est. Value
About This Home
This home is located at 3541 Desert Cliff St Unit 104, Las Vegas, NV 89129 and is currently estimated at $282,103, approximately $227 per square foot. 3541 Desert Cliff St Unit 104 is a home located in Clark County with nearby schools including Eileen Conners Elementary School, Justice Myron E Leavitt Middle School, and Centennial High School.
Ownership History
Date
Name
Owned For
Owner Type
Purchase Details
Closed on
Jul 10, 2013
Sold by
Ali Hasina
Bought by
Ali Hasina and Ali Kulsum
Current Estimated Value
Purchase Details
Closed on
Jan 11, 2011
Sold by
Federal Home Loan Mortgage Corporation
Bought by
Ali Hasina
Purchase Details
Closed on
Aug 10, 2010
Sold by
Friedman Todd A
Bought by
Federal Home Loan Mortgage Corporation
Purchase Details
Closed on
Dec 23, 2004
Sold by
Cliff Shadows Condominiums Llc
Bought by
Friedman Todd A
Home Financials for this Owner
Home Financials are based on the most recent Mortgage that was taken out on this home.
Original Mortgage
$110,658
Interest Rate
5.7%
Mortgage Type
Unknown
Create a Home Valuation Report for This Property
The Home Valuation Report is an in-depth analysis detailing your home's value as well as a comparison with similar homes in the area
Home Values in the Area
Average Home Value in this Area
Purchase History
| Date | Buyer | Sale Price | Title Company |
|---|---|---|---|
| Ali Hasina | -- | None Available | |
| Ali Hasina | $60,000 | Lsi Title Agency Inc | |
| Federal Home Loan Mortgage Corporation | $78,000 | North American Title Sunset | |
| Friedman Todd A | $138,322 | Chicago Title |
Source: Public Records
Mortgage History
| Date | Status | Borrower | Loan Amount |
|---|---|---|---|
| Previous Owner | Friedman Todd A | $110,658 |
Source: Public Records
Tax History Compared to Growth
Tax History
| Year | Tax Paid | Tax Assessment Tax Assessment Total Assessment is a certain percentage of the fair market value that is determined by local assessors to be the total taxable value of land and additions on the property. | Land | Improvement |
|---|---|---|---|---|
| 2025 | $892 | $58,789 | $19,950 | $38,839 |
| 2024 | $867 | $58,789 | $19,950 | $38,839 |
| 2023 | $867 | $60,820 | $25,200 | $35,620 |
| 2022 | $842 | $54,203 | $21,350 | $32,853 |
| 2021 | $817 | $51,051 | $19,250 | $31,801 |
| 2020 | $790 | $50,370 | $18,900 | $31,470 |
| 2019 | $767 | $47,983 | $16,800 | $31,183 |
| 2018 | $745 | $40,690 | $10,395 | $30,295 |
| 2017 | $1,280 | $39,033 | $8,050 | $30,983 |
| 2016 | $707 | $35,196 | $6,650 | $28,546 |
| 2015 | $704 | $25,559 | $4,550 | $21,009 |
| 2014 | $684 | $20,233 | $4,200 | $16,033 |
Source: Public Records
Map
Nearby Homes
- 3540 Cactus Shadow St Unit 201
- 3544 Desert Cliff St Unit 102
- 3455 Cactus Shadow St Unit 101
- 3644 Starlight Evening St
- 3360 Cactus Shadow St Unit 203
- 3351 Indian Shadow St Unit 204
- 3354 Indian Shadow St Unit 203
- 10516 Table Lands Ct
- 3321 Indian Shadow St Unit 104
- 3320 Cactus Shadow St Unit 201
- 10635 Solar Hawk Ave
- 10516 Cold Mountain Ave
- 10537 Hamdem Ave
- 3624 Breman St
- 3617 Austell St
- 10528 Tugaloo Ave
- 3740 Cedartown St
- 10635 Seasonable Dr
- 10456 Prairie Schooner Ave
- 10557 Shiny Skies Dr
- 3541 Desert Cliff St Unit 204
- 3541 Desert Cliff St Unit 101
- 3541 Desert Cliff St Unit 201
- 3541 Desert Cliff St Unit 102
- 3541 Desert Cliff St Unit 203
- 3541 Desert Cliff St Unit 202
- 3541 Desert Cliff St Unit 103
- 3571 Desert Cliff St Unit 103
- 3571 Desert Cliff St Unit 102
- 3571 Desert Cliff St Unit 204
- 3571 Desert Cliff St Unit 201
- 3571 Desert Cliff St Unit 104
- 3571 Desert Cliff St Unit 203
- 3571 Desert Cliff St Unit 202
- 3571 Desert Cliff St Unit 101
- 3540 Cactus Shadow St Unit 203
- 3540 Cactus Shadow St Unit 103
- 3540 Cactus Shadow St Unit 101
- 3540 Cactus Shadow St Unit 202
- 3540 Cactus Shadow St Unit 204