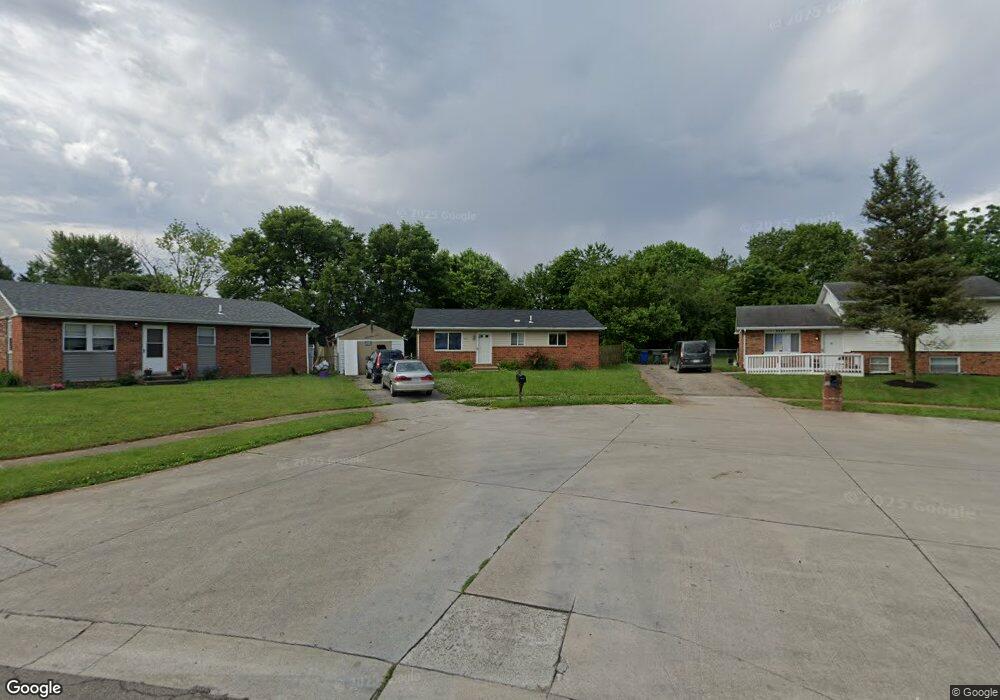
3541 Leach Dr Columbus, OH 43207
Obetz-Lockbourne NeighborhoodEstimated Value: $187,000 - $197,000
3
Beds
1
Bath
1,053
Sq Ft
$182/Sq Ft
Est. Value
About This Home
This home is located at 3541 Leach Dr, Columbus, OH 43207 and is currently estimated at $191,764, approximately $182 per square foot. 3541 Leach Dr is a home located in Franklin County with nearby schools including Parsons Elementary School, Buckeye Middle School, and Marion-Franklin High School.
Ownership History
Date
Name
Owned For
Owner Type
Purchase Details
Closed on
Nov 5, 2003
Sold by
Harmon Luke and Case #02Cve01 1124
Bought by
Mortgage Eletronic Registration System I
Current Estimated Value
Purchase Details
Closed on
Oct 23, 2003
Sold by
Mortgage Electronic Registration Systems
Bought by
Maynard Thomas
Purchase Details
Closed on
Mar 30, 2001
Sold by
Hill Jacqueline W and Hill Jacqueline W
Bought by
Harmon Luke
Home Financials for this Owner
Home Financials are based on the most recent Mortgage that was taken out on this home.
Original Mortgage
$68,000
Interest Rate
10.95%
Purchase Details
Closed on
Apr 21, 1997
Sold by
Hill Heather L
Bought by
Hill Jacqueline W
Home Financials for this Owner
Home Financials are based on the most recent Mortgage that was taken out on this home.
Original Mortgage
$45,500
Interest Rate
10.4%
Purchase Details
Closed on
Feb 13, 1992
Create a Home Valuation Report for This Property
The Home Valuation Report is an in-depth analysis detailing your home's value as well as a comparison with similar homes in the area
Home Values in the Area
Average Home Value in this Area
Purchase History
| Date | Buyer | Sale Price | Title Company |
|---|---|---|---|
| Mortgage Eletronic Registration System I | $55,000 | -- | |
| Maynard Thomas | $52,000 | Foundation Title Agency Inc | |
| Harmon Luke | $68,000 | Lawyers Title | |
| Hill Jacqueline W | $33,000 | Preferred Title Agency Inc | |
| -- | -- | -- |
Source: Public Records
Mortgage History
| Date | Status | Borrower | Loan Amount |
|---|---|---|---|
| Previous Owner | Harmon Luke | $68,000 | |
| Previous Owner | Hill Jacqueline W | $45,500 |
Source: Public Records
Tax History Compared to Growth
Tax History
| Year | Tax Paid | Tax Assessment Tax Assessment Total Assessment is a certain percentage of the fair market value that is determined by local assessors to be the total taxable value of land and additions on the property. | Land | Improvement |
|---|---|---|---|---|
| 2024 | $2,498 | $54,500 | $15,440 | $39,060 |
| 2023 | $2,466 | $54,495 | $15,435 | $39,060 |
| 2022 | $1,722 | $32,410 | $9,800 | $22,610 |
| 2021 | $1,725 | $32,410 | $9,800 | $22,610 |
| 2020 | $1,728 | $32,410 | $9,800 | $22,610 |
| 2019 | $1,668 | $26,820 | $8,160 | $18,660 |
| 2018 | $874 | $26,820 | $8,160 | $18,660 |
| 2017 | $1,724 | $26,820 | $8,160 | $18,660 |
| 2016 | $1,700 | $25,030 | $4,450 | $20,580 |
| 2015 | $774 | $25,030 | $4,450 | $20,580 |
| 2014 | $1,552 | $25,030 | $4,450 | $20,580 |
| 2013 | $806 | $26,355 | $4,690 | $21,665 |
Source: Public Records
Map
Nearby Homes
- 245 Marilla Rd
- 503 Ashwood Rd
- 202 Williams Rd
- 525 Ashwood Rd
- 3414 Parsons Ave
- 3714 Parsons Ave
- 3380 Parsons Ave
- 3691 Ferman Rd
- 400 Colton Rd
- 3691 Abney Rd
- 256 Rumsey Rd Unit 258
- 312 Harland Dr
- 0 Parsons Ave Unit 225012522
- 552 Harland Dr
- 3735 Christie Rd W
- 0 Jana Kay Ct
- 568 Glendora Rd
- 696 Williams Rd
- 3161 Lewis Rd
- 3940 Hillman Rd W