3541 Nebula Cir Anchorage, AK 99517
Turnagain NeighborhoodEstimated Value: $248,000 - $361,136
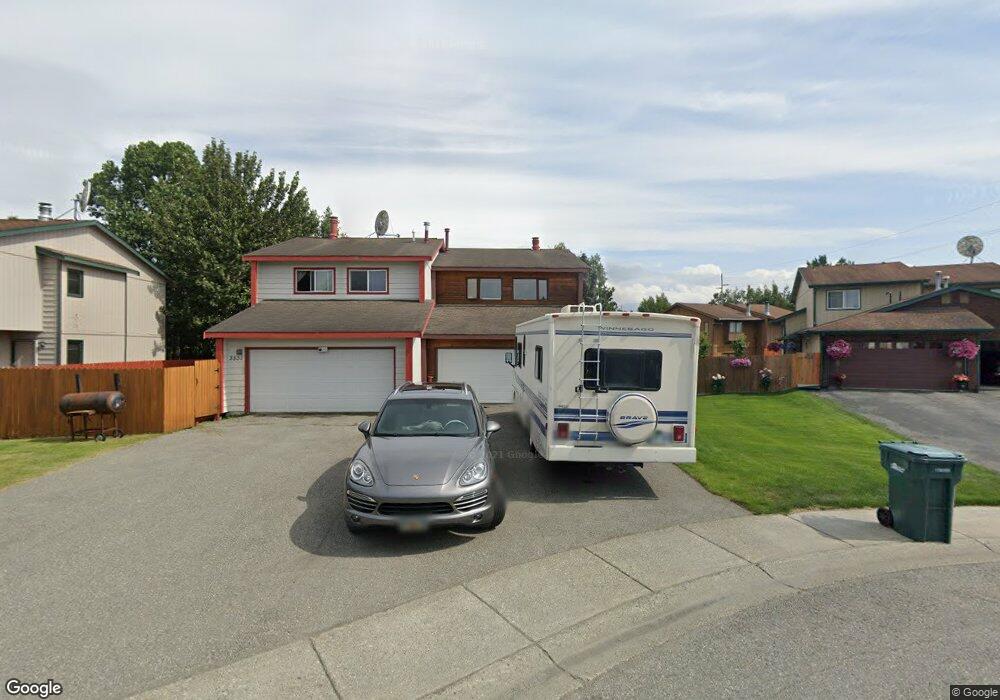
About This Home
This home is located at 3541 Nebula Cir, Anchorage, AK 99517 and is currently estimated at $319,712, approximately $241 per square foot. 3541 Nebula Cir is a home located in Anchorage Municipality with nearby schools including Lake Hood Elementary School, Romig Middle School, and West High School.
Ownership History
We collect this data history from publicly available records. To have your information removed, we recommend requesting removal directly through your county’s website.
Purchase Details
Home Financials for this Owner
Home Financials are based on the most recent Mortgage that was taken out on this home.Purchase Details
Purchase Details
Purchase Details
Home Financials for this Owner
Home Financials are based on the most recent Mortgage that was taken out on this home.Home Values in the Area
Average Home Value in this Area
Purchase History
We collect this data history from publicly available records. To have your information removed, we recommend requesting removal directly through your county’s website.
| Date | Buyer | Sale Price | Title Company |
|---|---|---|---|
| -- | None Available | ||
| -- | -- | ||
| -- | -- | ||
| -- | -- | ||
| -- | -- | ||
| -- | -- |
Mortgage History
We collect this data history from publicly available records. To have your information removed, we recommend requesting removal directly through your county’s website.
| Date | Status | Borrower | Loan Amount |
|---|---|---|---|
| Open | $137,000 | ||
| Previous Owner | $112,754 | ||
| Closed | $0 |
Tax History
We collect this data history from publicly available records. To have your information removed, we recommend requesting removal directly through your county’s website.
| Year | Tax Paid | Tax Assessment Tax Assessment Total Assessment is a certain percentage of the fair market value that is determined by local assessors to be the total taxable value of land and additions on the property. | Land | Improvement |
|---|---|---|---|---|
| 2025 | $3,872 | $320,200 | $84,000 | $236,200 |
| 2024 | $3,620 | $299,200 | $84,000 | $215,200 |
| 2023 | $4,624 | $271,500 | $84,000 | $187,500 |
| 2022 | $3,550 | $260,800 | $84,000 | $176,800 |
| 2021 | $4,372 | $242,600 | $84,000 | $158,600 |
| 2020 | $3,220 | $237,100 | $84,000 | $153,100 |
| 2019 | $3,141 | $240,000 | $84,000 | $156,000 |
| 2018 | $3,062 | $233,400 | $87,700 | $145,700 |
| 2017 | $3,430 | $239,000 | $83,200 | $155,800 |
| 2016 | $3,067 | $240,100 | $83,200 | $156,900 |
| 2015 | $3,067 | $231,200 | $76,000 | $155,200 |
| 2014 | $3,067 | $225,500 | $76,000 | $149,500 |
Map
- 3543 Sagan Cir
- 3481 Andree Dr Unit 8B
- 3419 Scarlet Place
- 3136 W 34th Ave
- 3640 Challenger Cir
- 3504 Vintage Cir
- 3326 W 30th Ave
- 3318 W 30th Ave
- 3100 Ward Place Unit 30
- 4013 Crosson Dr
- 3725 W 40th Ave Unit 4B
- 2810 Wiley Post Ave
- 2810 Gillam Cir
- 3913 Starburst Cir
- 000 Carleton Ave
- 2616 Mcrae Rd
- 3181 Horizon St
- 3333 Lakeshore Dr Unit 10
- 3333 Lakeshore Dr Unit 6
- 3333 Lakeshore Dr Unit 2
- 3531 Nebula Cir *Pvrm*
- 3531 Nebula Cir
- 3551 Nebula Cir
- 3521 Nebula Cir
- 3561 Nebula Cir
- 3354 Orion Cir
- 3348 Orion Cir
- 3511 Nebula Cir
- 3360 Orion Cir
- 3571 Nebula Cir
- 3342 Orion Cir
- 3581 Nebula Cir
- 3366 Orion Cir
- 3501 Nebula Cir
- 3591 Nebula Cir
- 3372 Orion Cir
- 3336 Orion Cir
- 3590 Nebula Cir
- 3481 Nebula Cir
- 3378 Orion Cir
Ask me questions while you tour the home.