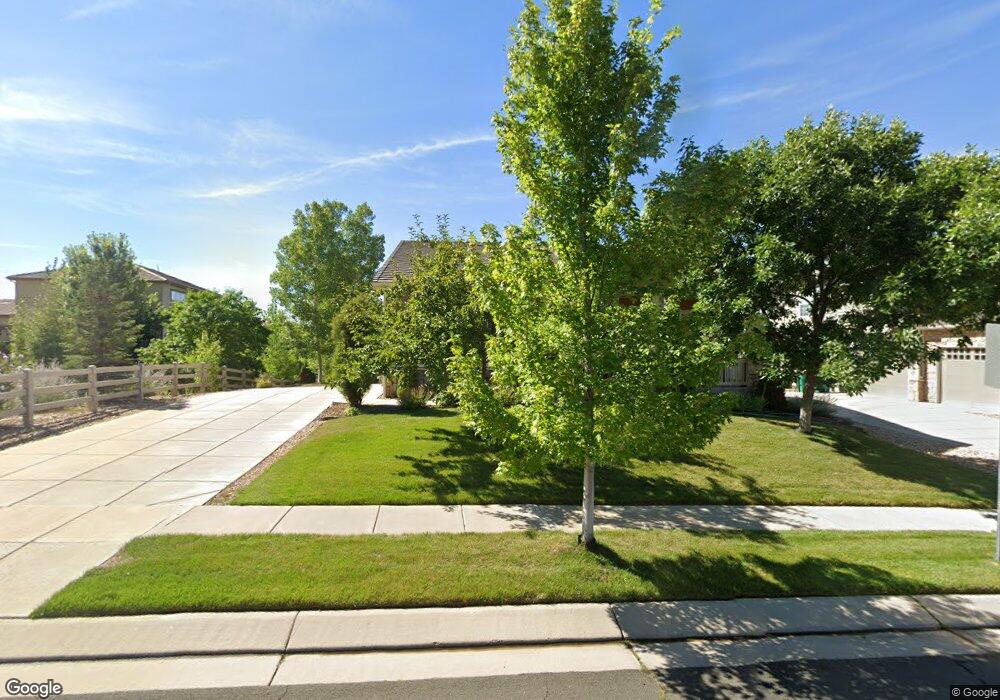
3542 Vestal Loop Broomfield, CO 80023
Anthem NeighborhoodEstimated Value: $809,579 - $883,000
3
Beds
2
Baths
2,104
Sq Ft
$405/Sq Ft
Est. Value
About This Home
This home is located at 3542 Vestal Loop, Broomfield, CO 80023 and is currently estimated at $852,895, approximately $405 per square foot. 3542 Vestal Loop is a home located in Broomfield County with nearby schools including Thunder Vista P-8, Legacy High School, and Prospect Ridge Academy.
Ownership History
Date
Name
Owned For
Owner Type
Purchase Details
Closed on
Jun 22, 2009
Sold by
Babinski Peter G and Babinski Holly F
Bought by
Cooprider Charles E and Cooprider Sheila C
Current Estimated Value
Home Financials for this Owner
Home Financials are based on the most recent Mortgage that was taken out on this home.
Original Mortgage
$185,000
Outstanding Balance
$117,326
Interest Rate
4.84%
Mortgage Type
Purchase Money Mortgage
Estimated Equity
$735,569
Purchase Details
Closed on
Nov 20, 2007
Sold by
Pulte Home Corp
Bought by
Babinski Peter G and Babinski Holly F
Home Financials for this Owner
Home Financials are based on the most recent Mortgage that was taken out on this home.
Original Mortgage
$249,590
Interest Rate
6.42%
Mortgage Type
Purchase Money Mortgage
Create a Home Valuation Report for This Property
The Home Valuation Report is an in-depth analysis detailing your home's value as well as a comparison with similar homes in the area
Home Values in the Area
Average Home Value in this Area
Purchase History
| Date | Buyer | Sale Price | Title Company |
|---|---|---|---|
| Cooprider Charles E | $385,000 | Title America | |
| Babinski Peter G | $374,590 | Land Title Guarantee Company |
Source: Public Records
Mortgage History
| Date | Status | Borrower | Loan Amount |
|---|---|---|---|
| Open | Cooprider Charles E | $185,000 | |
| Previous Owner | Babinski Peter G | $249,590 |
Source: Public Records
Tax History Compared to Growth
Tax History
| Year | Tax Paid | Tax Assessment Tax Assessment Total Assessment is a certain percentage of the fair market value that is determined by local assessors to be the total taxable value of land and additions on the property. | Land | Improvement |
|---|---|---|---|---|
| 2025 | $5,864 | $55,100 | $13,940 | $41,160 |
| 2024 | $5,864 | $53,260 | $13,030 | $40,230 |
| 2023 | $5,818 | $60,450 | $14,460 | $45,990 |
| 2022 | $4,694 | $40,910 | $10,480 | $30,430 |
| 2021 | $4,844 | $42,090 | $10,780 | $31,310 |
| 2020 | $4,634 | $40,140 | $10,040 | $30,100 |
| 2019 | $5,661 | $40,420 | $10,110 | $30,310 |
| 2018 | $5,445 | $36,930 | $7,920 | $29,010 |
| 2017 | $5,094 | $40,830 | $8,760 | $32,070 |
| 2016 | $5,158 | $35,510 | $8,760 | $26,750 |
| 2015 | $5,371 | $30,800 | $7,960 | $22,840 |
| 2014 | $4,949 | $30,800 | $7,960 | $22,840 |
Source: Public Records
Map
Nearby Homes
- 3481 Vestal Loop
- 16611 Plateau Ln
- 3457 Parkside Center Dr
- 1465 Blue Sky Cir Unit 204
- 1450 Blue Sky Way Unit 102
- 1450 Blue Sky Way Unit 12-105
- 1425 Blue Sky Cir Unit 15-303
- 2855 Blue Sky Cir Unit 104
- 2900 Blue Sky Cir Unit 5-103
- 3172 Traver Dr
- 3095 Blue Sky Cir Unit 13-203
- 2985 Blue Sky Cir Unit 7-104
- 3155 Blue Sky Cir Unit 16-303
- 2875 Blue Sky Cir Unit 4-208
- 16392 Spanish Peak Way
- 16526 Chesapeake Dr
- 3290 Discovery Ct
- 16626 Las Brisas Dr
- 16345 Spanish Peak Way
- 4263 Corte Bella Dr
- 3564 Vestal Loop
- 16719 Canby Way
- 16707 Canby Way
- 16728 Buckskin Way
- 3541 Vestal Loop
- 3563 Vestal Loop
- 16714 Buckskin Way
- 3535 Vestal Loop
- 16708 Buckskin Way
- 3587 Vestal Loop
- 3519 Vestal Loop
- 3601 Vestal Loop
- 16722 Canby Way
- 3495 Vestal Loop
- 16710 Canby Way
- 3605 Vestal Loop
- 16729 Buckskin Way
- 16717 Buckskin Way
- 16690 Pinnacle Ct
- 3611 Vestal Loop