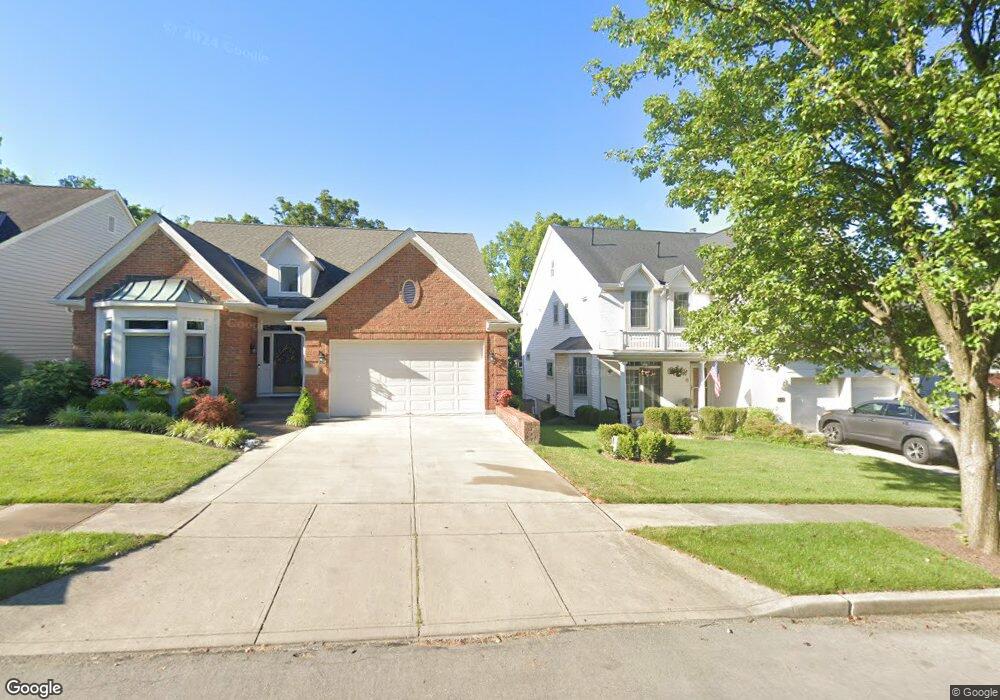
3543 Totten Ave Cincinnati, OH 45226
Mount Lookout NeighborhoodEstimated Value: $992,000 - $1,172,929
5
Beds
4
Baths
4,875
Sq Ft
$221/Sq Ft
Est. Value
About This Home
This home is located at 3543 Totten Ave, Cincinnati, OH 45226 and is currently estimated at $1,075,732, approximately $220 per square foot. 3543 Totten Ave is a home located in Hamilton County with nearby schools including Kilgour Elementary School, Clark Montessori High School, and Shroder High School.
Ownership History
Date
Name
Owned For
Owner Type
Purchase Details
Closed on
Feb 26, 2019
Sold by
Brannock Kristen K and Brannock John M
Bought by
Brannock Kristen K and Brannock John M
Current Estimated Value
Purchase Details
Closed on
Feb 16, 2011
Sold by
Kispert Helen M
Bought by
Brannock Kristen K
Home Financials for this Owner
Home Financials are based on the most recent Mortgage that was taken out on this home.
Original Mortgage
$255,000
Outstanding Balance
$175,069
Interest Rate
4.85%
Mortgage Type
Unknown
Estimated Equity
$900,663
Purchase Details
Closed on
Sep 2, 2008
Sold by
Kispert John F and Kispert Helen M
Bought by
Kispert Helen M
Purchase Details
Closed on
Sep 30, 1994
Sold by
Delta Group
Bought by
Kispert John F and Kispert Helen M
Home Financials for this Owner
Home Financials are based on the most recent Mortgage that was taken out on this home.
Original Mortgage
$125,000
Interest Rate
8.91%
Create a Home Valuation Report for This Property
The Home Valuation Report is an in-depth analysis detailing your home's value as well as a comparison with similar homes in the area
Home Values in the Area
Average Home Value in this Area
Purchase History
| Date | Buyer | Sale Price | Title Company |
|---|---|---|---|
| Brannock Kristen K | -- | None Available | |
| Brannock Kristen K | $615,000 | Prominent Title | |
| Kispert Helen M | -- | Multi State Title Agency | |
| Kispert John F | -- | -- |
Source: Public Records
Mortgage History
| Date | Status | Borrower | Loan Amount |
|---|---|---|---|
| Open | Brannock Kristen K | $255,000 | |
| Previous Owner | Kispert John F | $125,000 |
Source: Public Records
Tax History Compared to Growth
Tax History
| Year | Tax Paid | Tax Assessment Tax Assessment Total Assessment is a certain percentage of the fair market value that is determined by local assessors to be the total taxable value of land and additions on the property. | Land | Improvement |
|---|---|---|---|---|
| 2024 | $16,412 | $274,883 | $56,308 | $218,575 |
| 2023 | $16,782 | $274,883 | $56,308 | $218,575 |
| 2022 | $17,326 | $254,608 | $53,403 | $201,205 |
| 2021 | $16,677 | $254,608 | $53,403 | $201,205 |
| 2020 | $17,166 | $254,608 | $53,403 | $201,205 |
| 2019 | $16,027 | $217,613 | $45,644 | $171,969 |
| 2018 | $16,052 | $217,613 | $45,644 | $171,969 |
| 2017 | $15,250 | $217,613 | $45,644 | $171,969 |
| 2016 | $16,215 | $228,165 | $41,993 | $186,172 |
| 2015 | $14,616 | $228,165 | $41,993 | $186,172 |
| 2014 | $14,721 | $228,165 | $41,993 | $186,172 |
| 2013 | $14,131 | $215,251 | $39,617 | $175,634 |
Source: Public Records
Map
Nearby Homes
- 690 Totten Way Unit 2
- 680 Totten Way
- 764 Delta Ave
- 600 Delta Ave
- 572 Missouri Ave
- 2942 Lower Grandin Rd
- 575 Delta Ave
- 628 Rushton Rd
- 3255 Linwood Ave
- 571 Delta Ave
- 559 Delta Terrace
- 555 Delta Ave
- 459 Flinn Ave
- 455 Flinn Ave
- 565 Hoge St
- 3293 Linwood Ave
- 690 Reisling Knoll
- 536 Hoge St
- 3556 Handman Ave
- 3554 Handman Ave
- 3545 Totten Ave
- 3539 Totten Ave
- 3555 Totten Ave
- 3537 Totten Ave
- 3536 Totten Ave
- 688 Totten Way
- 3544 Totten Ave
- 3540 Totten Ave
- 801 Ellison Ave
- 3548 Totten Ave
- 686 Totten Way
- 3550 Totten Ave
- 684 Totten Way
- 682 Totten Way
- 3560 Kroger Ave
- 692 Totten Way
- 3558 Kroger Ave
- 3568 Kroger Ave
- 3554 Kroger Ave
- 678 Totten Way