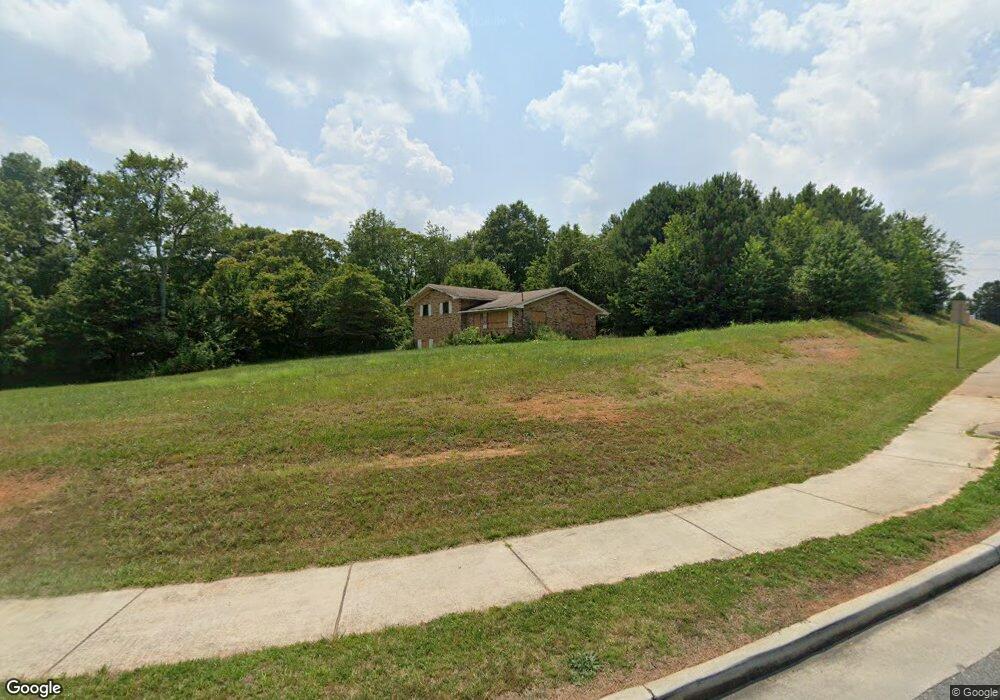
3544 Carter Rd Buford, GA 30518
Estimated Value: $355,000 - $862,612
2
Beds
1
Bath
1,264
Sq Ft
$524/Sq Ft
Est. Value
About This Home
This home is located at 3544 Carter Rd, Buford, GA 30518 and is currently estimated at $662,653, approximately $524 per square foot. 3544 Carter Rd is a home located in Hall County with nearby schools including Buford Elementary School, Buford Academy, and Buford Senior Academy.
Ownership History
Date
Name
Owned For
Owner Type
Purchase Details
Closed on
Dec 27, 2019
Sold by
Patel Hiren
Bought by
Gobran Ahedy
Current Estimated Value
Purchase Details
Closed on
Oct 28, 2015
Sold by
Desai Hargovindbhai
Bought by
Patel Hiren
Home Financials for this Owner
Home Financials are based on the most recent Mortgage that was taken out on this home.
Original Mortgage
$240,000
Interest Rate
2.98%
Purchase Details
Closed on
Mar 10, 2014
Sold by
Shelby Property Llc
Bought by
Desai Hargovindbhai
Purchase Details
Closed on
Aug 7, 2012
Sold by
Hall County Tax Commission
Bought by
Shelby Property Llc
Purchase Details
Closed on
May 15, 2007
Sold by
Veal Peggy Jean
Bought by
Desai Hargovindbhai
Purchase Details
Closed on
Dec 9, 2004
Sold by
Veal Charles Ray
Bought by
Veal Peggy Jean
Create a Home Valuation Report for This Property
The Home Valuation Report is an in-depth analysis detailing your home's value as well as a comparison with similar homes in the area
Home Values in the Area
Average Home Value in this Area
Purchase History
| Date | Buyer | Sale Price | Title Company |
|---|---|---|---|
| Gobran Ahedy | $200,000 | -- | |
| Patel Hiren | $240,000 | -- | |
| Desai Hargovindbhai | $70,000 | -- | |
| Shelby Property Llc | -- | -- | |
| Desai Hargovindbhai | $575,000 | -- | |
| Veal Peggy Jean | -- | -- |
Source: Public Records
Mortgage History
| Date | Status | Borrower | Loan Amount |
|---|---|---|---|
| Previous Owner | Patel Hiren | $240,000 |
Source: Public Records
Tax History
| Year | Tax Paid | Tax Assessment Tax Assessment Total Assessment is a certain percentage of the fair market value that is determined by local assessors to be the total taxable value of land and additions on the property. | Land | Improvement |
|---|---|---|---|---|
| 2025 | $6,006 | $291,240 | $261,600 | $29,640 |
| 2024 | $6,092 | $290,720 | $261,600 | $29,120 |
| 2023 | $2,486 | $294,000 | $261,600 | $32,400 |
| 2022 | $2,782 | $303,880 | $261,600 | $42,280 |
| 2021 | $2,800 | $290,122 | $261,600 | $28,522 |
| 2020 | $789 | $266,442 | $237,920 | $28,522 |
| 2019 | $2,695 | $266,442 | $237,920 | $28,522 |
| 2018 | $2,764 | $266,442 | $237,920 | $28,522 |
| 2017 | $2,872 | $266,442 | $237,920 | $28,522 |
| 2016 | $940 | $266,442 | $237,920 | $28,522 |
| 2015 | $2,267 | $266,442 | $237,920 | $28,522 |
| 2014 | $2,267 | $228,562 | $200,040 | $28,522 |
Source: Public Records
Map
Nearby Homes
- 119 Holiday Rd Unit 1202
- 900 Gainesville Hwy
- 0 McEver Rd Unit 10506093
- 879 Gainesville Hwy
- 454 Thunder Rd
- 452 Thunder Rd
- 450 Thunder Rd
- 4653 Whispering Pines Unit 449
- 5758 Hickory Wood Ln
- 5758 Hickory Wood Ln Unit 336
- 403 Thunder Rd
- 981 Atlanta Hwy
- 436 Thunder Rd
- 5165 Sycamore Trail Unit 285
- 5165 Sycamore Trail
- 3180 Lee Dr
- 3394 Lee Dr
- 405 Thunder Rd
- 2999 S Waterworks Rd
- 6108 Hutchins Dr
- 3532 Carter Rd
- 3524 Carter Rd
- 0 Carter Rd Unit 8097601
- 3520 Carter Rd
- 928 Gainesville Hwy
- 5221 Lanier Islands Pkwy
- 3582 Carter Rd
- 105 Holiday Rd
- 922 Gainesville Hwy
- 5703 Green Rd
- 119 Holiday Rd Unit 202
- 119 Holiday Rd Unit 502
- 119 Holiday Rd Unit 1604
- 119 Holiday Rd Unit 803
- 119 Holiday Rd Unit 1901
- 119 Holiday Rd Unit 2001
- 119 Holiday Rd Unit 602
- 119 Holiday Rd Unit 1804
- 119 Holiday Rd Unit 904
- 119 Holiday Rd Unit 1603
Your Personal Tour Guide
Ask me questions while you tour the home.