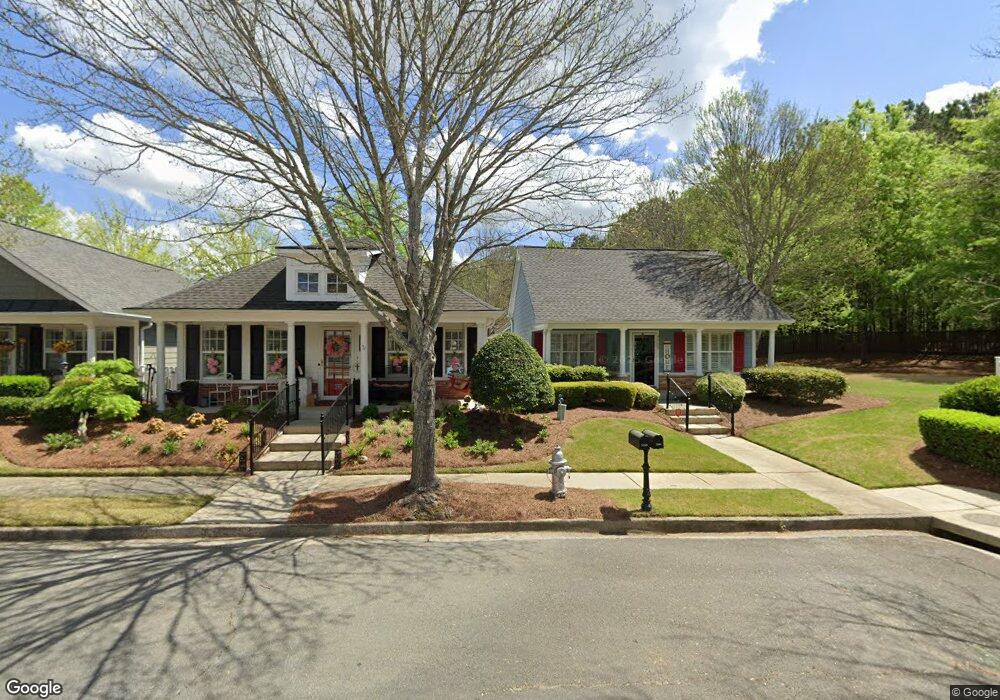
3544 Flowering Springs Powder Springs, GA 30127
Estimated Value: $370,012 - $395,000
3
Beds
2
Baths
1,877
Sq Ft
$201/Sq Ft
Est. Value
About This Home
This home is located at 3544 Flowering Springs, Powder Springs, GA 30127 and is currently estimated at $377,503, approximately $201 per square foot. 3544 Flowering Springs is a home located in Cobb County with nearby schools including Powder Springs Elementary School, Cooper Middle School, and McEachern High School.
Ownership History
Date
Name
Owned For
Owner Type
Purchase Details
Closed on
Aug 15, 2025
Sold by
Oneal William
Bought by
Oneal William and Oneal Karen
Current Estimated Value
Home Financials for this Owner
Home Financials are based on the most recent Mortgage that was taken out on this home.
Original Mortgage
$304,000
Outstanding Balance
$303,734
Interest Rate
6.67%
Mortgage Type
New Conventional
Estimated Equity
$73,769
Purchase Details
Closed on
Apr 20, 2007
Sold by
Marty Nancy L
Bought by
Mcgregor Sharon
Purchase Details
Closed on
Jun 27, 2003
Sold by
Mckenzie & Perry Homes Inc
Bought by
Marty Nancy L
Home Financials for this Owner
Home Financials are based on the most recent Mortgage that was taken out on this home.
Original Mortgage
$119,000
Interest Rate
5.2%
Mortgage Type
New Conventional
Create a Home Valuation Report for This Property
The Home Valuation Report is an in-depth analysis detailing your home's value as well as a comparison with similar homes in the area
Home Values in the Area
Average Home Value in this Area
Purchase History
| Date | Buyer | Sale Price | Title Company |
|---|---|---|---|
| Oneal William | -- | None Listed On Document | |
| Oneal William | $380,000 | None Listed On Document | |
| Mcgregor Sharon | $225,000 | -- | |
| Marty Nancy L | $169,900 | -- |
Source: Public Records
Mortgage History
| Date | Status | Borrower | Loan Amount |
|---|---|---|---|
| Open | Oneal William | $304,000 | |
| Previous Owner | Marty Nancy L | $119,000 |
Source: Public Records
Tax History Compared to Growth
Tax History
| Year | Tax Paid | Tax Assessment Tax Assessment Total Assessment is a certain percentage of the fair market value that is determined by local assessors to be the total taxable value of land and additions on the property. | Land | Improvement |
|---|---|---|---|---|
| 2025 | $997 | $156,004 | $26,000 | $130,004 |
| 2024 | $1,000 | $156,004 | $26,000 | $130,004 |
| 2023 | $753 | $142,484 | $26,000 | $116,484 |
| 2022 | $838 | $101,752 | $20,000 | $81,752 |
| 2021 | $838 | $101,752 | $20,000 | $81,752 |
| 2020 | $807 | $91,628 | $20,000 | $71,628 |
| 2019 | $807 | $91,628 | $20,000 | $71,628 |
| 2018 | $807 | $91,628 | $20,000 | $71,628 |
| 2017 | $654 | $73,620 | $15,600 | $58,020 |
| 2016 | $655 | $73,620 | $15,600 | $58,020 |
| 2015 | $638 | $67,524 | $15,600 | $51,924 |
| 2014 | $650 | $67,524 | $0 | $0 |
Source: Public Records
Map
Nearby Homes
- 3542 Flowering Springs
- 3540 Flowering Springs
- 3538 Flowering Springs
- 3583 Lilac Springs Dr
- 3581 Lilac Springs Dr
- 3536 Flowering Springs
- 3577 Lilac Springs Dr
- 3579 Lilac Springs Dr
- 3534 Flowering Springs
- 3575 Lilac Springs Dr
- 3585 Lilac Springs Dr
- 3532 Flowering Springs
- 3573 Lilac Springs Dr
- 3537 Flowering Springs
- 3587 Lilac Springs Dr
- 3571 Lilac Springs Dr
- 3535 Flowering Springs
- 3584 Lilac Springs Dr
- 3589 Lilac Springs Dr
- 3533 Flowering Springs